Full Report
The numbers behind Expand Energy Corporation: as-reported financial statements and company metrics for FY2021–FY2025, traced to the source filings, opened with the share-price history those statements have to justify. Every linked figure opens the exact page of the filing it was printed on, with the statement row highlighted. Amounts in US$ millions unless noted.
Reading notes: All figures in US$ millions as printed, except per-share (US$) and share counts. Source: SEC Forms 10-K and 10-Q. Fresh-start accounting: Chesapeake Energy emerged from Chapter 11 on February 9, 2021. FY2021 annual columns present the Successor period (Feb 10 - Dec 31, 2021); the ~40-day Predecessor stub (which carried a 5,569 non-cash reorganization gain and 5,383 net income) is excluded and is not comparable. Merger: Chesapeake completed its all-stock merger with Southwestern Energy on October 1, 2024 and renamed to Expand Energy Corporation. FY2024 results include Southwestern only from October 1; FY2025 is the first full combined year, which drives the step-up in revenue, assets, share count and DD A. FY2021-FY2023 reflect standalone Chesapeake. FY2025, FY2024 and FY2023 income-statement and cash-flow figures are the three comparative columns of the FY2025 Form 10-K (pp.114-115). FY2022 and FY2021 (Successor) income/cash-flow figures are comparative columns of the FY2023 Form 10-K (pp.129,131).
Share Price — Full Available History — 5 Years
The stock closed at $91.52 on Jul 24, 2026 — up 114% over the window shown (+15.0% a year), trading between $41.60 and $122.89. At that close the stock trades at 12× FY2025 diluted EPS as reported below.
Source: market price feed, weekly closes, sampled from 1,369 source observations, Feb 2021–Jul 2026. Price return only, excludes dividends.
Market capitalization $69.9bn and enterprise value $74.3bn.
Market cap = 764.0M shares outstanding × the Jul 24, 2026 close of $91.52. Enterprise value adds total debt of $5.0bn and subtracts cash and equivalents of $616mn (net debt of $4.4bn), from the FY2025 balance sheet. Market-derived figures, shown without filing links.
FY2025 at a Glance
Revenue (US$ millions)
Net income (US$ millions)
Diluted EPS
Source: FY2025 consolidated statements [1] [2]. Click any linked figure to open the filing page with the row highlighted.
Revenue by Product
| Revenue by Product | FY2021 | FY2022 | FY2023 | FY2024 | FY2025 |
|---|---|---|---|---|---|
| Natural gas | — | — | 2,853 | 2,686 | 7,433 |
| Oil | — | — | 596 | 69 | 319 |
| NGL | — | — | 98 | 214 | 724 |
| Natural gas, oil and NGL revenue | — | — | 3,547 | 2,969 | 8,476 |
| Marketing revenue | — | — | 2,500 | 1,290 | 3,163 |
| Total product and marketing revenue | — | — | 6,047 | 4,259 | 11,639 |
| Total product and marketing revenue growth, derived | — | — | — | -29.6% | +173.3% |
Source: Note 8 Revenue — revenue disaggregated by product type [3]. Click any linked figure to open the filing page with the row highlighted.
Income Statement
Source: Consolidated Statements of Operations [1] [2]. Click any linked figure to open the filing page with the row highlighted.
Columns marked E are consensus analyst estimates from S&P Capital IQ (CapIQ), shown alongside reported results for direct comparison; they are not company guidance.
Estimate source: S&P Capital IQ (CapIQ) consensus, as of 2026-07-27. Estimate figures are S&P Capital IQ consensus (vendor data — no filing page links). EPS and net income use the normalized (adjusted) consensus where the street reports it. Consensus revenue sits well below the as-reported line for the last actual year — analysts often model a narrower revenue basis (e.g. net of interest or pass-through costs), so compare trends, not levels. Line-item analyst models (segments, drivers, KPIs) are in the Visible Alpha tab.
Balance Sheet
Source: Consolidated Balance Sheets [4] [5] [6] [7]. Click any linked figure to open the filing page with the row highlighted.
Cash Flow
Source: Consolidated Statements of Cash Flows [8] [9]. Click any linked figure to open the filing page with the row highlighted.
Natural Gas, Oil and NGL Revenue by Operating Area
| Natural Gas, Oil and NGL Revenue by Operating Area | FY2021 | FY2022 | FY2023 | FY2024 | FY2025 |
|---|---|---|---|---|---|
| Haynesville | — | — | 1,300 | 1,205 | 3,477 |
| Northeast Appalachia | — | — | 1,483 | 1,242 | 2,860 |
| Southwest Appalachia | — | — | — | 522 | 2,139 |
| Eagle Ford | — | — | 764 | — | — |
| Natural gas, oil and NGL revenue | — | — | 3,547 | 2,969 | 8,476 |
Source: Note 8 Revenue — revenue disaggregated by operating area [3]. Click any linked figure to open the filing page with the row highlighted.
Production Volumes
| Production Volumes | FY2021 | FY2022 | FY2023 | FY2024 | FY2025 |
|---|---|---|---|---|---|
| Total production (Bcfe) | — | 1,461 | 1,335 | 1,375 | 2,622 |
| Natural gas production (Bcf) | — | 1,308 | 1,266 | 1,321 | 2,409 |
| Total production per day (MMcfe/d) | — | — | 3,659 | 3,758 | 7,183 |
Source: company filings [10] [11] [12] [13]. Click any linked figure to open the filing page with the row highlighted.
Realized Prices
| Realized Prices | FY2021 | FY2022 | FY2023 | FY2024 | FY2025 |
|---|---|---|---|---|---|
| Natural gas realized ($/Mcf, excl. hedging) | — | 5.96 | 2.25 | 2.03 | 3.08 |
| Oil realized ($/Bbl) | — | 96.07 | 77.80 | 60.41 | 54.47 |
| NGL realized ($/Bbl) | — | 37.48 | 25.62 | 27.44 | 24.48 |
| Total realized ($/Mcfe, excl. hedging) | — | 6.77 | 2.66 | 2.16 | 3.23 |
| Total realized incl. derivatives ($/Mcfe) | — | — | 2.99 | 2.84 | 3.30 |
| Average NYMEX natural gas ($/Mcf) | — | — | 2.74 | 2.27 | 3.43 |
Source: company filings [10] [11] [12] [14]. Click any linked figure to open the filing page with the row highlighted.
Unit Costs ($/Mcfe)
| Unit Costs ($/Mcfe) | FY2021 | FY2022 | FY2023 | FY2024 | FY2025 |
|---|---|---|---|---|---|
| Production expense ($/Mcfe) | — | 0.33 | 0.27 | 0.23 | 0.24 |
| Gathering, processing and transportation ($/Mcfe) | — | 0.73 | 0.64 | 0.75 | 0.91 |
| Depreciation, depletion and amortization ($/Mcfe) | — | — | 1.14 | 1.26 | 1.13 |
| General and administrative, net ($/Mcfe) | — | — | 0.09 | 0.14 | 0.07 |
Source: company filings [15] [11] [16] [14]. Click any linked figure to open the filing page with the row highlighted.
Proved Reserves PV-10
| Proved Reserves PV-10 | FY2021 | FY2022 | FY2023 | FY2024 | FY2025 |
|---|---|---|---|---|---|
| Total proved reserves (Bcfe) | — | — | 9,688 | 20,800 | 25,880 |
| Proved developed reserves (Bcfe) | — | — | 6,363 | 16,958 | 18,576 |
| Proved undeveloped reserves (Bcfe) | — | — | 3,325 | 3,842 | 7,304 |
| PV-10 of proved reserves | — | — | 4,571 | 7,567 | 19,374 |
| Standardized measure | — | — | 4,477 | 7,531 | 17,126 |
| Estimated future net revenue | — | — | 8,554 | 13,669 | 37,002 |
Source: company filings [17] [18] [19]. Click any linked figure to open the filing page with the row highlighted.
Drilling Wells
| Drilling Wells | FY2021 | FY2022 | FY2023 | FY2024 | FY2025 |
|---|---|---|---|---|---|
| Gross wells completed | — | — | 194 | 87 | 311 |
| Net wells completed | — | — | 109 | 62 | 203 |
| Gross producing wells (working interest) | — | — | — | — | 6,600 |
Source: company filings [20]. Click any linked figure to open the filing page with the row highlighted.
Long-Term Record
| Fiscal year | Total revenues and other | Net income (loss) | Net cash provided by operating activities | Capital expenditures | Diluted earnings (loss) per share |
|---|---|---|---|---|---|
| FY2016 | — | (4,390) | (204) | — | — |
| FY2017 | — | (505) | 475 | — | — |
| FY2018 | — | 226 | 1,730 | — | — |
| FY2019 | — | (308) | 1,623 | — | — |
| FY2020 | 5,240 | (9,734) | 1,164 | (1,142) | — |
| FY2021 | 5,549 | 945 | 1,809 | (669) | 8.12 |
| FY2022 | 11,743 | 4,936 | 4,125 | (1,823) | 33.36 |
| FY2023 | 8,721 | 2,419 | 2,380 | (1,829) | 16.92 |
| FY2024 | 4,235 | (714) | 1,565 | (1,557) | (4.55) |
| FY2025 | 12,124 | 1,819 | 4,575 | (2,736) | 7.57 |
Source: consolidated statements across filings; older years from the standardized feed [8] [1] [9] [2]. Click any linked figure to open the filing page with the row highlighted.
Analyst Consensus
Mean target
Median target
High target
Low target
Street ratings: 17 strong buy, 3 buy, 6 hold. Consensus: Buy.
Estimate source: S&P Capital IQ (CapIQ) consensus, as of 2026-07-27. Estimate figures are S&P Capital IQ consensus (vendor data — no filing page links). EPS and net income use the normalized (adjusted) consensus where the street reports it. Consensus revenue sits well below the as-reported line for the last actual year — analysts often model a narrower revenue basis (e.g. net of interest or pass-through costs), so compare trends, not levels. Line-item analyst models (segments, drivers, KPIs) are in the Visible Alpha tab.
Traceability
371 of 386 figures on this page (96%) link to the filing page where they are printed — click a linked figure to open the source PDF at that page with the row highlighted. Unlinked figures come from standardized data feeds or pre-filing years.
All figures in US$ millions as printed, except per-share (US$) and share counts. Source: SEC Forms 10-K and 10-Q.
Fresh-start accounting: Chesapeake Energy emerged from Chapter 11 on February 9, 2021. FY2021 annual columns present the Successor period (Feb 10 - Dec 31, 2021); the ~40-day Predecessor stub (which carried a 5,569 non-cash reorganization gain and 5,383 net income) is excluded and is not comparable.
Merger: Chesapeake completed its all-stock merger with Southwestern Energy on October 1, 2024 and renamed to Expand Energy Corporation. FY2024 results include Southwestern only from October 1; FY2025 is the first full combined year, which drives the step-up in revenue, assets, share count and DD A. FY2021-FY2023 reflect standalone Chesapeake.
FY2025, FY2024 and FY2023 income-statement and cash-flow figures are the three comparative columns of the FY2025 Form 10-K (pp.114-115). FY2022 and FY2021 (Successor) income/cash-flow figures are comparative columns of the FY2023 Form 10-K (pp.129,131).
Balance-sheet columns are each cited to a 10-K that prints that year-end: FY2025/FY2024 from the FY2025 10-K (p.113), FY2023 from the FY2024 10-K (p.114), FY2022 from the FY2023 10-K (p.128), FY2021 from the FY2022 10-K (p.92).
Revenue by product and by operating area are from Note 8 (FY2025 10-K, p.143), which discloses FY2023-FY2025 only; the 'Gain (loss) on derivatives' and 'Gains (losses) on sales of assets' lines are excluded from the revenue-mix tables (they appear in the income statement).
Long-Term Record FY2016-FY2020 figures are from the standardized SEC XBRL data feed and are shown without page links; revenue and diluted EPS are omitted for those years (revenue absent from the feed; pre-emergence EPS is not comparable). FY2020 revenue is the comparative column of the FY2022 10-K.
Quarterly block covers the five most recent quarters with standalone SEC filings (Q1 FY25 - Q1 FY26), all post-merger and comparable. See per-statement notes for the derivation of Q4 FY25 and of single-quarter cash flows.
2 figure(s) differed between the data feed and the filing; the filing value is shown (see the run's metrics/metrics_tab.json for the audit trail).
Expand Energy Corporation's management answers for the business every quarter. These are the exchanges that explain it best — verbatim, from the call transcripts preserved in Sources. Each link opens the full transcript at that page in a new tab.
Q1 2026 Earnings Call — Q1 FY2026
The newest call and the new-era playbook: turning the largest US gas position into higher margins via LNG, power and volatility marketing while cutting debt. · Open the full transcript →
The bull case in management's words: AI power, reshoring and LNG converging on the lowest-breakeven Haynesville inventory.
Michael Wichterich (Interim President & CEO): There is no disputing our industry is in the midst of a major demand growth. The big 3 drivers of demand, AI power, the reshoring of heavy industry and global LNG growth are converging to make the future bright for natural gas. […] According to third-party reports, today, we own 72% of the lowest breakeven inventory in the basin, allowing us to deliver certified natural gas directly to LNG facilities with minimal risk of basis blowouts.
p. 1 · Read in context →
The marketing strategy quantified: ~$0.20/Mcf, ~$500M/yr of repeatable free cash flow across three levers.
Michael Wichterich (Interim President & CEO): On our last call, we stated the size of the prize of this effort is about $0.20 of margin improvement, which equates to approximately $500 million of repeatable incremental free cash flow per year. We do not believe that we have to swing for the fence searching for one transformational deal. We will be disciplined and create value by stacking singles and doubles across 3 general categories: First, reaching premium markets. […] Second, monetizing volatility. In the first quarter alone, we generated nearly $90 million incremental value […] Finally, facilitating and capturing new demand. Today, we announced a new offtake SPA with Delfin LNG for 1.15 million tons per year
p. 2 · Read in context →
How LNG fits: an extension of the Haynesville, reaching for premium international pricing (JKM/TTF) via the Delfin SPA.
Michael Wichterich (Interim President & CEO): Number one, our LNG strategy is really an extension of our Haynesville. We think about it more broadly than I believe most, which is we think about first, delivering gas to the Gulf Coast, which we think will ultimately be a premium market because it's connected to all of the LNG facilities. […] When we start to think about on the water, of course, LNG, we think about that as international pricing. We want exposure to the prices, whether it be JKM or TTF or others. Delfin is the start, and we'll call it a foundational sort of contract
p. 3 · Read in context →
New CFO Marcel Teunissen on the financial anchor: an industry-leading sub-$3 breakeven and staying investment grade.
Doug Leggate (Wolfe Research); Marcel Teunissen (EVP & CFO): We are kind of leading there within the industry, well below $3 now on a breakeven price. And that breakeven price by capturing margin will just create more value for our shareholders when we do that. […] it's important for us to be investment grade. We're a big company. We are a counterparty. People need to be able to rely on us.
p. 4 · Read in context →
Q4 & Full-Year 2025 Earnings Call — Q4 FY2025
The reset call: management change and a Houston move announced, with a candid case that drilling great wells is no longer enough — Expand must compete on marketing. · Open the full transcript →
The operational headline: a 15% cut in Haynesville breakevens, letting the company lower 2026 maintenance capital.
Michael Wichterich (Chairman & Interim CEO): We have a 15% reduction in our breakevens in the Haynesville. That is very difficult to do. The team should be congratulated on that. It is phenomenal. It does not just help our reinvestment rate; it also helps our inventory. […] when we talk about 2026, we have reduced our maintenance capital. That is proof positive that the team is working and working well.
p. 1 · Read in context →
The pivot stated plainly — great wells are no longer enough — framing the leadership change and Houston move.
Michael Wichterich (Chairman & Interim CEO): We have to say, it is not good enough anymore to just drill great wells. We have to compete on the marketing side of our business. […] These changes, as all changes, have some unfortunate elements. Obviously, our senior leadership has changed, but that does not change our mission or our strategy. What you are seeing is a change in tactics and focus.
p. 2 · Read in context →
Why the Haynesville is the crown jewel: unmatched inventory depth and quality; five years of sub-$3.50 inventory added in one year.
Matthew Portillo (TPH); Josh Viets (Chief Operating Officer): The reality is the inventory that we carry in the Haynesville is simply unmatched. It is both in terms of depth and quality. […] In just one year alone, we have been able to add five years of inventory below $3.50.
p. 4 · Read in context →
Capital-allocation priority in a volatile business: a fantastic balance sheet first, then buybacks.
Doug Leggate (Wolfe Research); Michael Wichterich (Chairman & Interim CEO): As far as paying down debt versus buyback shares, of course, we like to do both. We have done both this year and continue to do both. But we are in a volatile commodity business. Having a fantastic balance sheet comes first. That is why you are seeing our priority to pay down debt.
p. 5 · Read in context →
Q3 2024 Earnings Call — Q3 FY2024
Expand's first earnings call: the merger logic, a raised ~$500M synergy target, and the deferred-capacity playbook that lets the company spend less to produce more. · Open the full transcript →
The merger's promise in numbers: 120% more production for 80% more capital, with synergies raised toward $500M by 2027.
Nick Dell'Osso (Chief Executive Officer): Our preliminary outlook for 2025 includes approximately $2.7 billion of total capital to deliver an average of 7 BCFE per day. Compared to Chesapeake's standalone maintenance level, this represents a 120% increase in production with only an 80% increase in capital. […] we expect to achieve approximately $225 million in synergies, which is more than 50% of our original synergy target next year and are well on our way to achieving the full $500 million annual target by year-end 2027.
p. 1 · Read in context →
Q1 2024 Earnings Call (Chesapeake Energy) — Q1 FY2024
The clearest primer on how the business runs: defer wells and curtail output in an oversupplied market to build capacity for the recovery, plus the hedge-to-wedge philosophy. · Open the full transcript →
The core operating model up front: defer wells, build DUCs and curtail output in an oversupplied market to hold capacity for the recovery.
Nick Dell'Osso (Chief Executive Officer): Today, the natural gas market is clearly oversupplied. Our 2024 plan is focused on discipline, operational efficiency and free cash flow generation while building the productive capacity needed to deliver for consumers when demand recovers. […] Through the first quarter, we have deferred 22 turn-in-lines and built 24 drilled but uncompleted wells. In addition, we began curtailing base production in February, averaging approximately 200 million cubic feet a day of curtailment in the first quarter. As we continue building productive capacity, we expect to curtail approximately 400 million cubic feet a day in the second quarter.
p. 1 · Read in context →
An early read on the AI/data-center power wave — and why the two-basin footprint is built to answer it.
Nitin Kumar (Mizuho); Nick Dell'Osso (Chief Executive Officer): But what has really taken hold in the last couple of months is that there is a recognition that the massive growth in demand for data centers, significantly driven by the growth in demand around AI tools, is going to put a big draw on power grids. We think that's all very real and very interesting. […] we, as a stand-alone company, have a really large production base and as a pro forma combined company have the largest production base in both the Appalachia and Haynesville with which to be ready to respond.
p. 3 · Read in context →
The activation sequence: price is only an indicator; turn-in-lines come back first, then DUCs, then curtailed base volumes.
Joshua Silverstein (UBS); Nick Dell'Osso (Chief Executive Officer): We get asked a lot about what price are you going to bring volumes back online? Of course, that's an easy way to think about it and an easy way to model it, but it's not the right way for us to make that decision. When we think about price, we think about it as an indicator of what's going on in the underlying market, but the trajectory of what's going on in the underlying market matters a lot more to us than what the price is at the moment. […] The fastest thing for us to respond with are the wells that have been drilled and completed that are just waiting to be turned in line. Following that, we would begin to work on completing the additional wells that would have been drilled but are uncompleted. Certainly, I guess, along that time, we will be bringing back volumes that are curtailed out of the base.
p. 6 · Read in context →
More calls
Q3 2025 Earnings Call — Q3 FY2025 · 13 pages · Nick Dell'Osso's last quarterly call before his February 2026 exit — continued Haynesville breakeven progress and the early marketing push toward premium markets. · Open →
Q2 2025 Earnings Call — Q2 FY2025 · 11 pages · A mid-integration progress check on well costs, hedging and shareholder returns, with the full pre-transition bench (Dell'Osso, Singh, Viets, Turco). · Open →
Q1 2025 Earnings Call — Q1 FY2025 · 15 pages · The first quarter reported under full-year 2025 guidance — how the deferred-capacity build from 2024 converts into production and free cash flow. · Open →
Q4 & Full-Year 2024 Earnings Call — Q4 FY2024 · 14 pages · Expand's first full-year results and formal 2025 guidance: synergy capture, the capital-returns framework, and the plan for activating deferred volumes. · Open →
Q2 2024 Earnings Call (Chesapeake Energy) — Q2 FY2024 · 9 pages · The last Chesapeake-branded quarter before the Southwestern merger closed — FTC review, curtailment discipline and merger-integration prep. · Open →
Expand Energy Corporation's annual reports contain management's most considered account of the business. These are the sections, passages and visual pages worth opening in the originals preserved in Sources.
Expand Energy Corporation — FY2025 Annual Report (Form 10-K) — FY2025
The first full year as Expand Energy: post-Southwestern, investment-grade, S&P 500, the largest U.S. gas producer. · Open the full document →
Item 1. Business — p. 18 · Read the full section →
What the company is today — a three-basin, pure-play gas producer built by the October 2024 Southwestern merger.
Largest U.S. gas producer across Haynesville and Appalachia; $1.2B debt cut, S&P 500, $865M returned.
Expand Energy is the largest independent natural gas producer in the U.S., based on net daily production, and is focused on responsibly developing an abundant supply of natural gas, oil and NGL to expand energy access for all. Our operations are located in Louisiana and Texas in the Haynesville and Bossier Shales (“Haynesville”), in Pennsylvania in the Marcellus Shale (“Northeast Appalachia”) and in West Virginia and Ohio in the Marcellus and Utica Shales (“Southwest Appalachia”) and include working interests in approximately 6,600 gross natural gas and oil wells. […] Since completing our merger with Southwestern, we’ve continued to focus on strengthening our balance sheet by reducing total debt by approximately $1.2 billion and upsized our 2025 Credit Facility capacity to $3.5 billion. In 2025, we joined the S&P 500 index and returned approximately $865 million to shareholders through dividends and share repurchases.
p. 18 · Read in context →
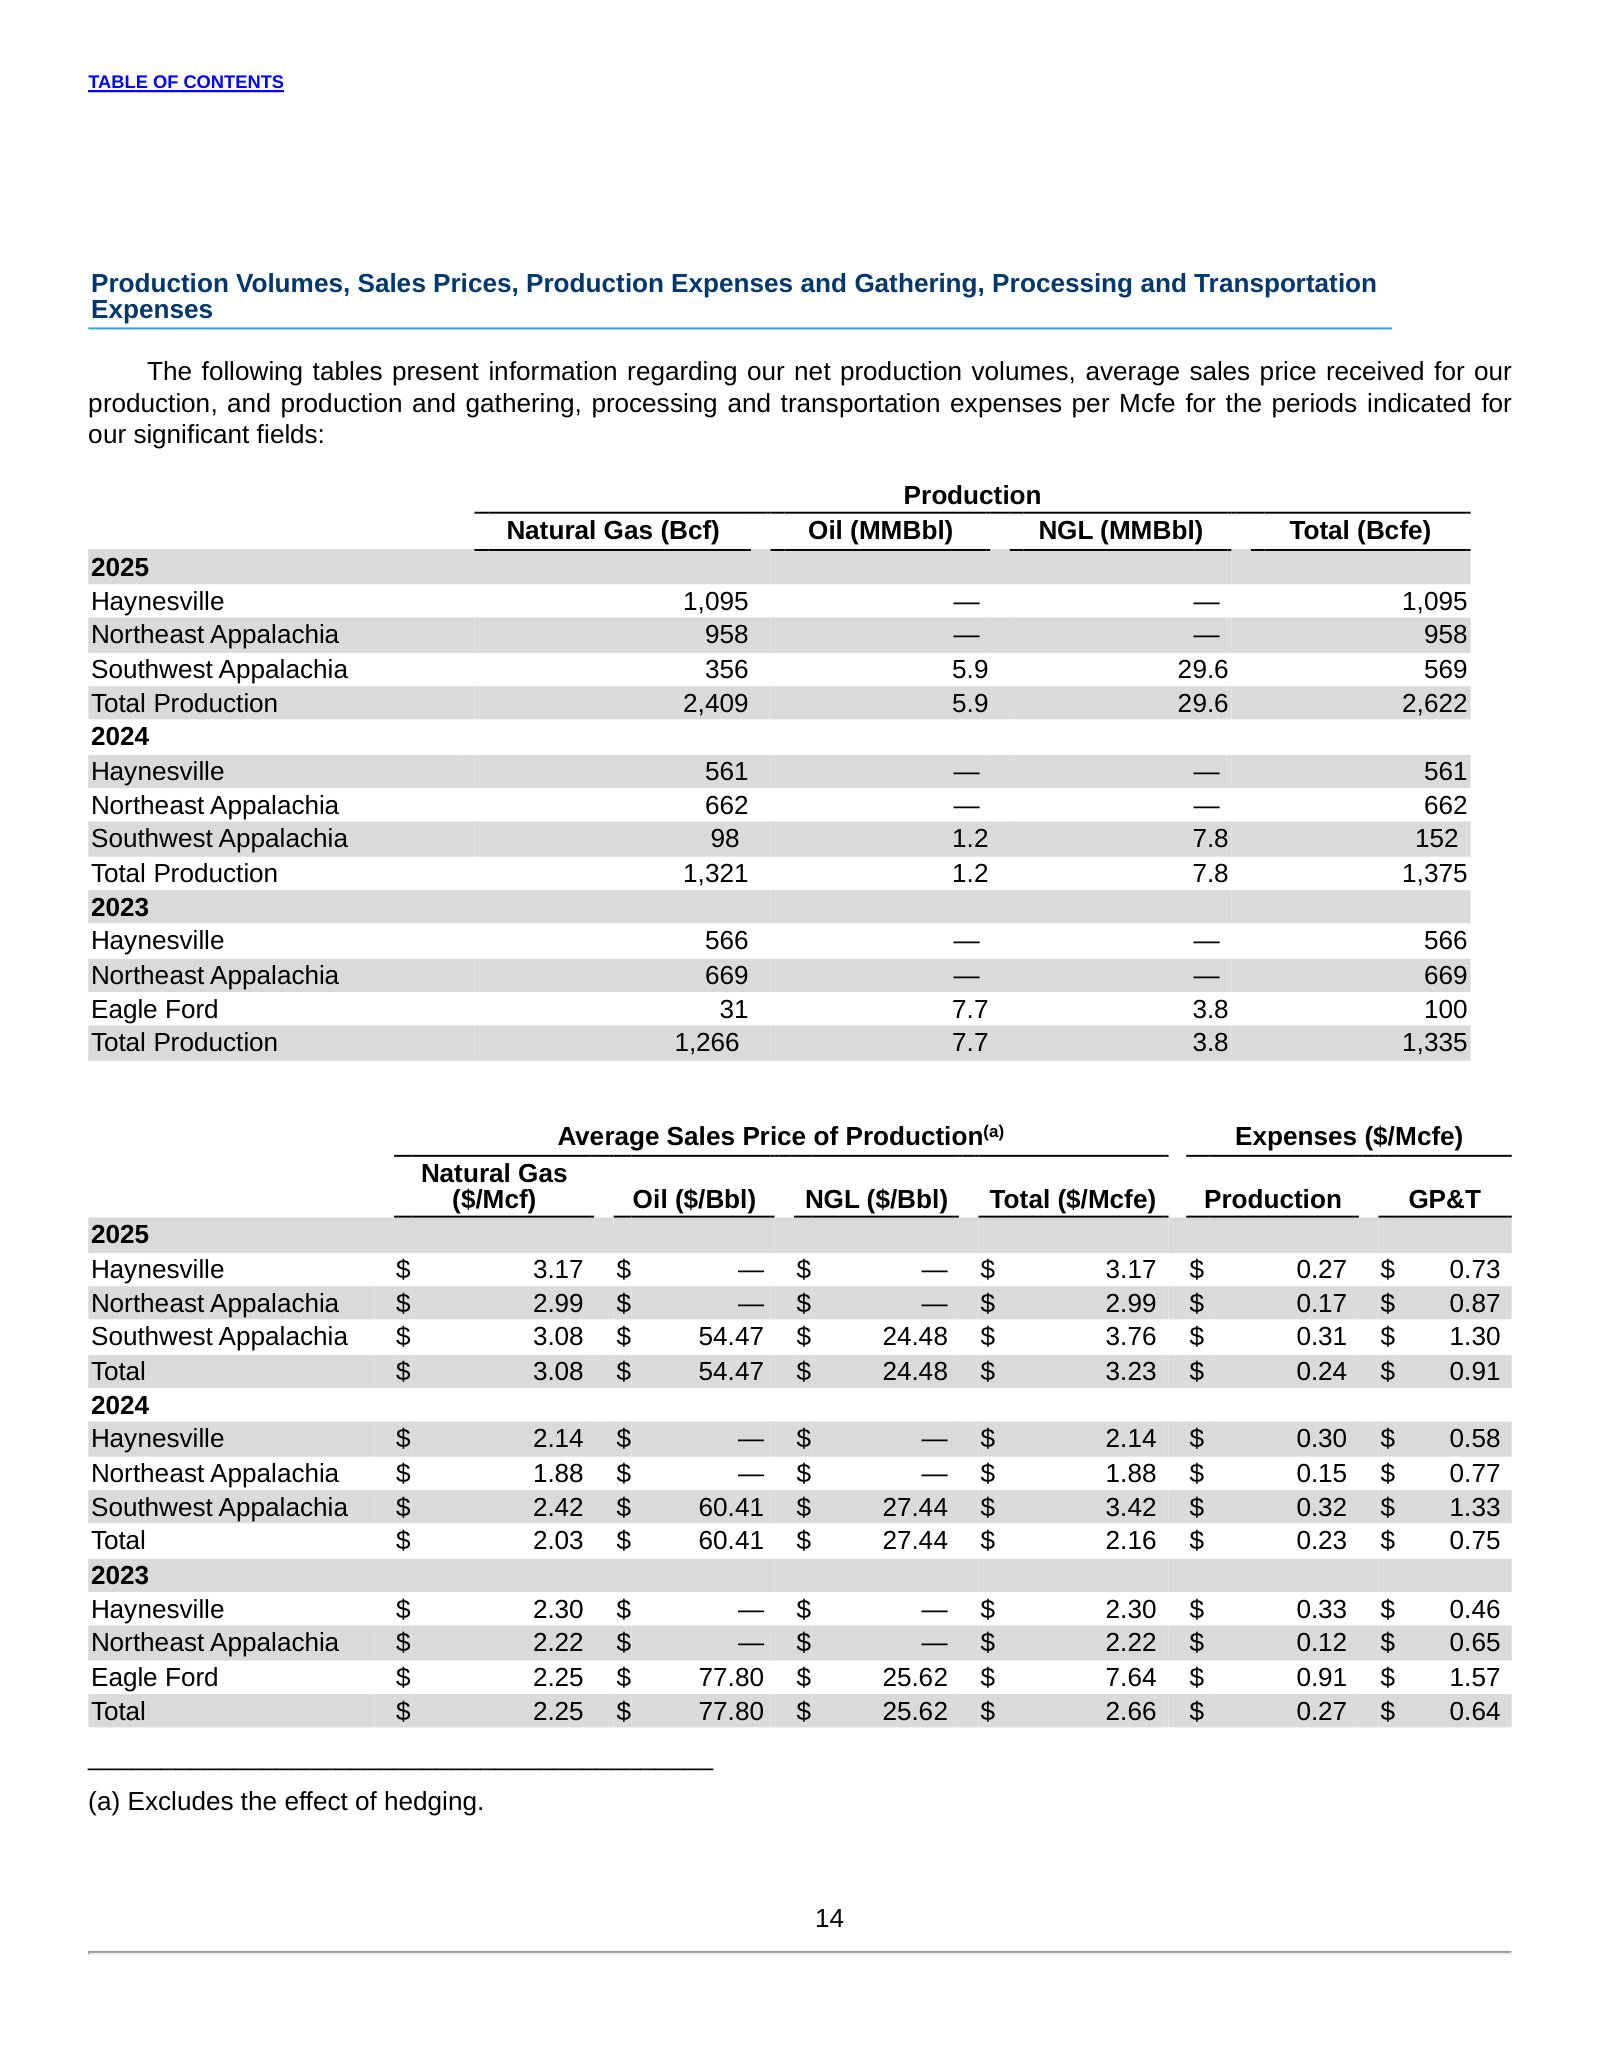
Natural Gas, Oil and NGL Reserves — p. 22 · Read the full section →
The core asset: 25.9 Tcfe proved, a $17.1B standardized measure, and how PUDs nearly doubled in a year.
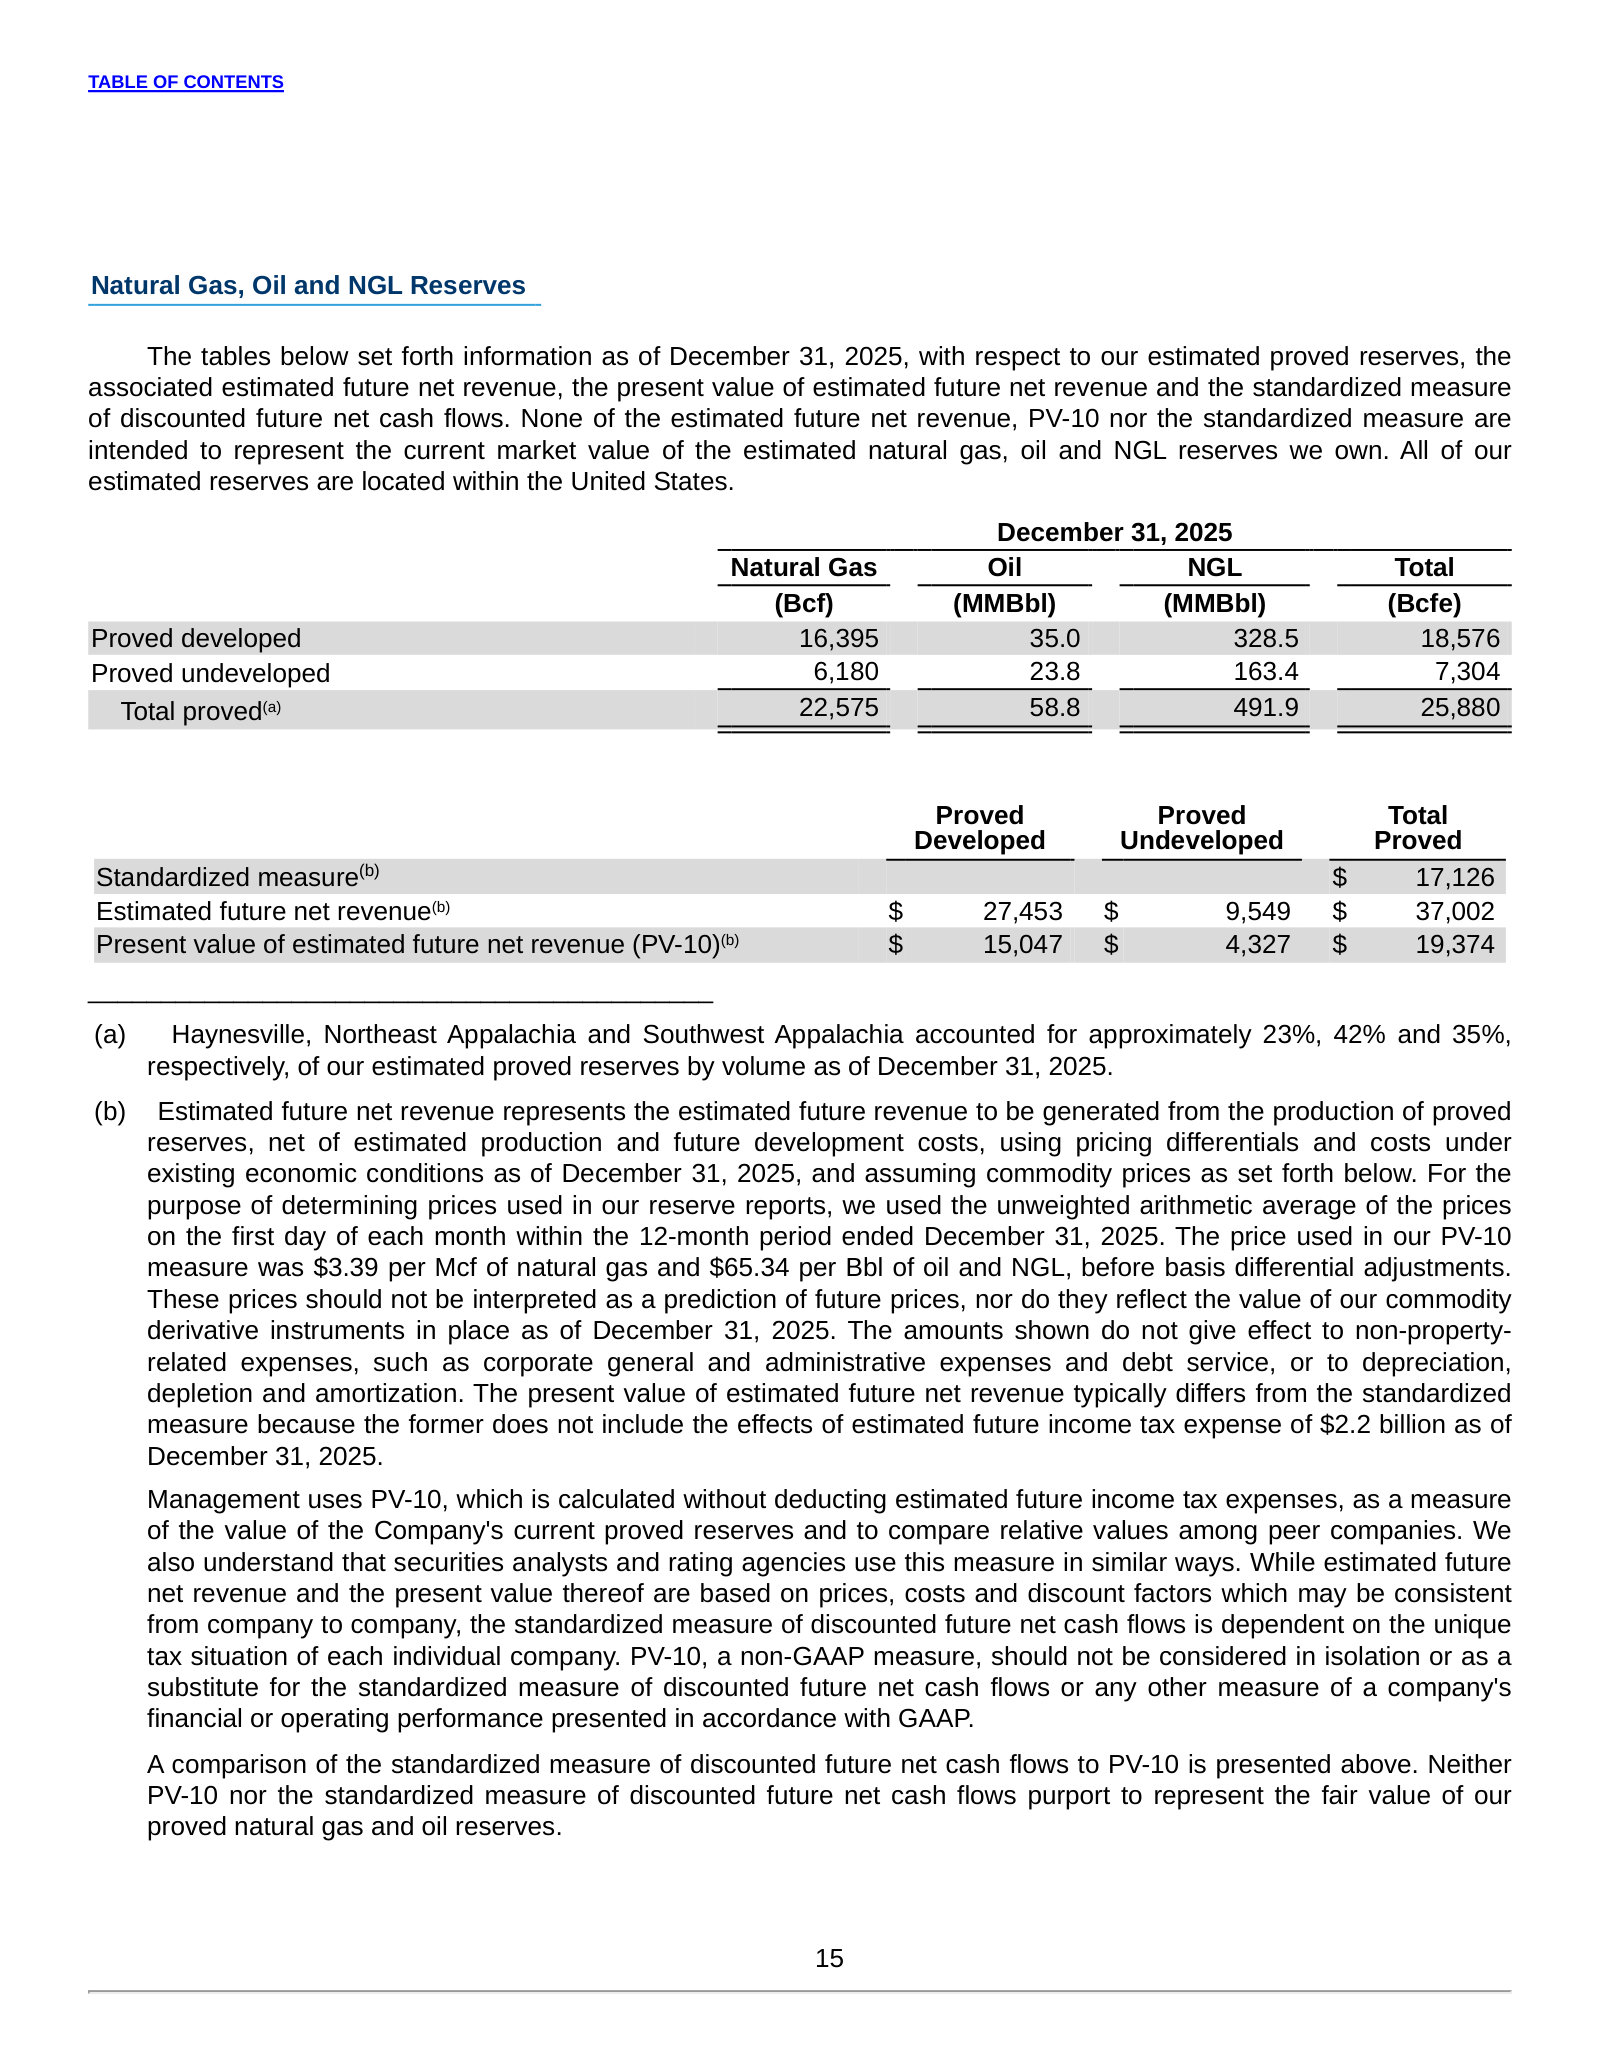
PUDs jumped to 7,304 Bcfe on a 4,998 Bcfe upward revision from newly economic locations.
As of December 31, 2025, our proved reserve estimates included 7,304 Bcfe of reserves classified as proved undeveloped, compared to 3,842 Bcfe as of December 31, 2024. […] We had a net upward revision in previous estimates of 4,998 Bcfe. The net upward revision primarily consisted of 5,430 Bcfe of upward revisions due to new PUDs that had improved economics and were in areas previously classified as proved.
p. 23 · Read in context →
Item 1A. Risk Factors — p. 42 · Read the full section →
The two risks that actually move this stock: gas-price swings and the property write-downs they trigger.
Results depend primarily on the prices received for gas, oil and NGL; sustained lows bite.
Our revenues, results of operations, profitability, liquidity, leverage ratio and ability to grow and invest in capital expenditures depend primarily upon the prices we receive for the natural gas, oil and NGL we sell. We incur substantial expenditures to replace reserves, sustain production and fund our business plans. Low natural gas, oil and NGL prices can negatively affect the amount of cash available for capital expenditures, debt service and debt repayment and our ability to borrow money or raise additional capital and, as a result, could have a material adverse effect on our financial condition, results of operations, cash flows and reserves.
p. 42 · Read in context →
Successful-efforts impairment: low prices or reserve cuts force non-cash write-downs of property.
The successful efforts method of accounting requires that we periodically review the carrying value of our natural gas and oil properties for possible impairment. Impairment is recognized for the excess of book value over fair value when the book value of a proven property is greater than the expected undiscounted future net cash flows from that property and on acreage when conditions indicate the carrying value is not recoverable. […] A write-down constitutes a non-cash charge to earnings and does not impact cash or cash flows from operating activities; however, it reflects our longterm ability to recover an investment, reduces our reported earnings and increases certain leverage ratios.
p. 46 · Read in context →
Item 7. MD&A — Recent and Significant Developments — p. 89 · Read the full section →
The year's defining events — $7.9B merger close, investment-grade ratings, capital returns, and a February 2026 CEO change.
Southwestern merger closed for ~$7.9B in stock; S&P assigned a BBB- investment-grade rating.
On October 1, 2024, we completed the Southwestern Merger and issued approximately 95.7 million shares of our common stock to Southwestern’s shareholders in connection with the Merger Agreement. […] On October 1, 2024, we received an investment grade rating from S&P Global Ratings (“S&P”). S&P assigned an issuer-level rating of ‘BBB-’ on our unsecured debt and raised our issuer credit rating to ‘BBB-’, with a stable outlook.
p. 89 · Read in context →
2025 capital-return framework: $2.30 base dividend, $1B debt reduction, 75% of remaining FCF.
In 2025, we prioritized paying the base dividend of $2.30 per share and $1.0 billion of annual net debt reduction, with 75% of the remaining free cash flow distributed, as market conditions warranted, through share repurchases and additional dividend payments. During 2025, we made dividend payments of $765 million, repurchased 0.9 million shares for an aggregate price of $100 million, reduced the principal amount of our debt through senior notes repayments as noted above, and increased our cash on hand.
p. 90 · Read in context →
Item 7. MD&A — Results of Operations — p. 98 · Read the full section →
How a full year of Southwestern roughly doubled volumes, and how hedging shaped realized prices versus NYMEX.
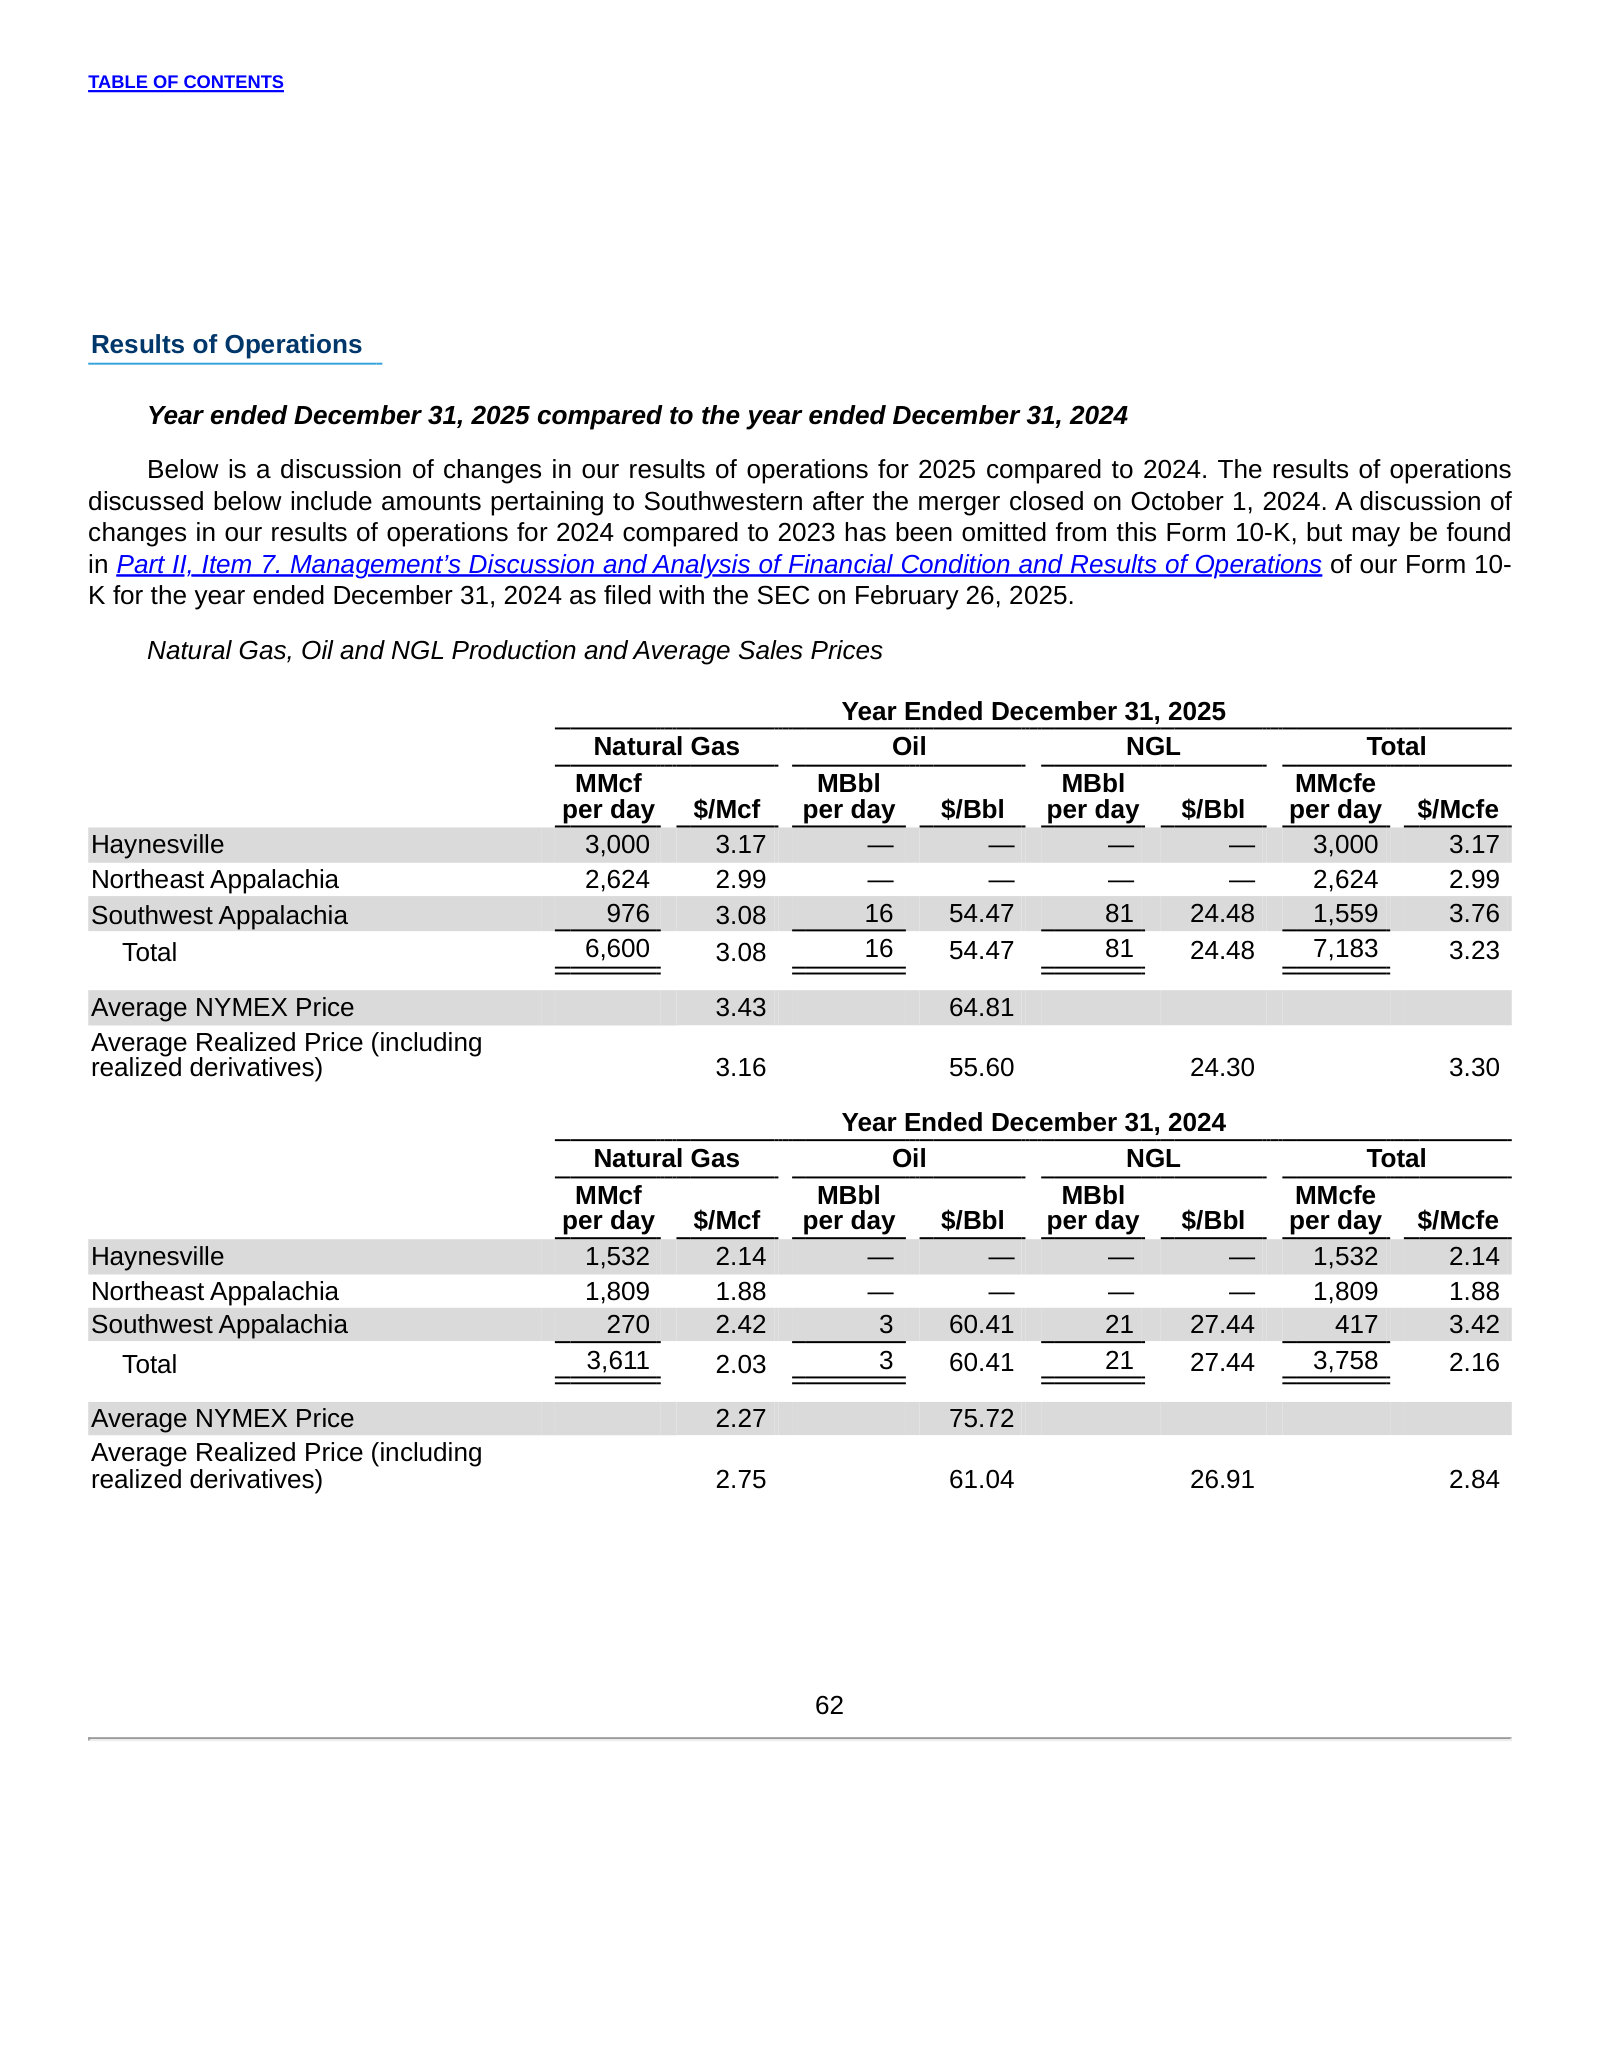
Critical Accounting Estimates — p. 105 · Read the full section →
The accounting choices that govern earnings: reserve estimates and the successful-efforts method.
Reserves are the most significant estimate; properties carried under the successful-efforts method.
Natural Gas and Oil Reserves. Estimates of natural gas and oil reserves and their values, future production rates, future development costs and commodity pricing differentials are the most significant of our estimates. […] The Company’s principal assets are its natural gas and oil properties, which are accounted for under the successful efforts accounting method. The Company determines the fair value of acquired natural gas and oil properties based on the discounted future net cash flows expected to be generated from these assets.
p. 105 · Read in context →
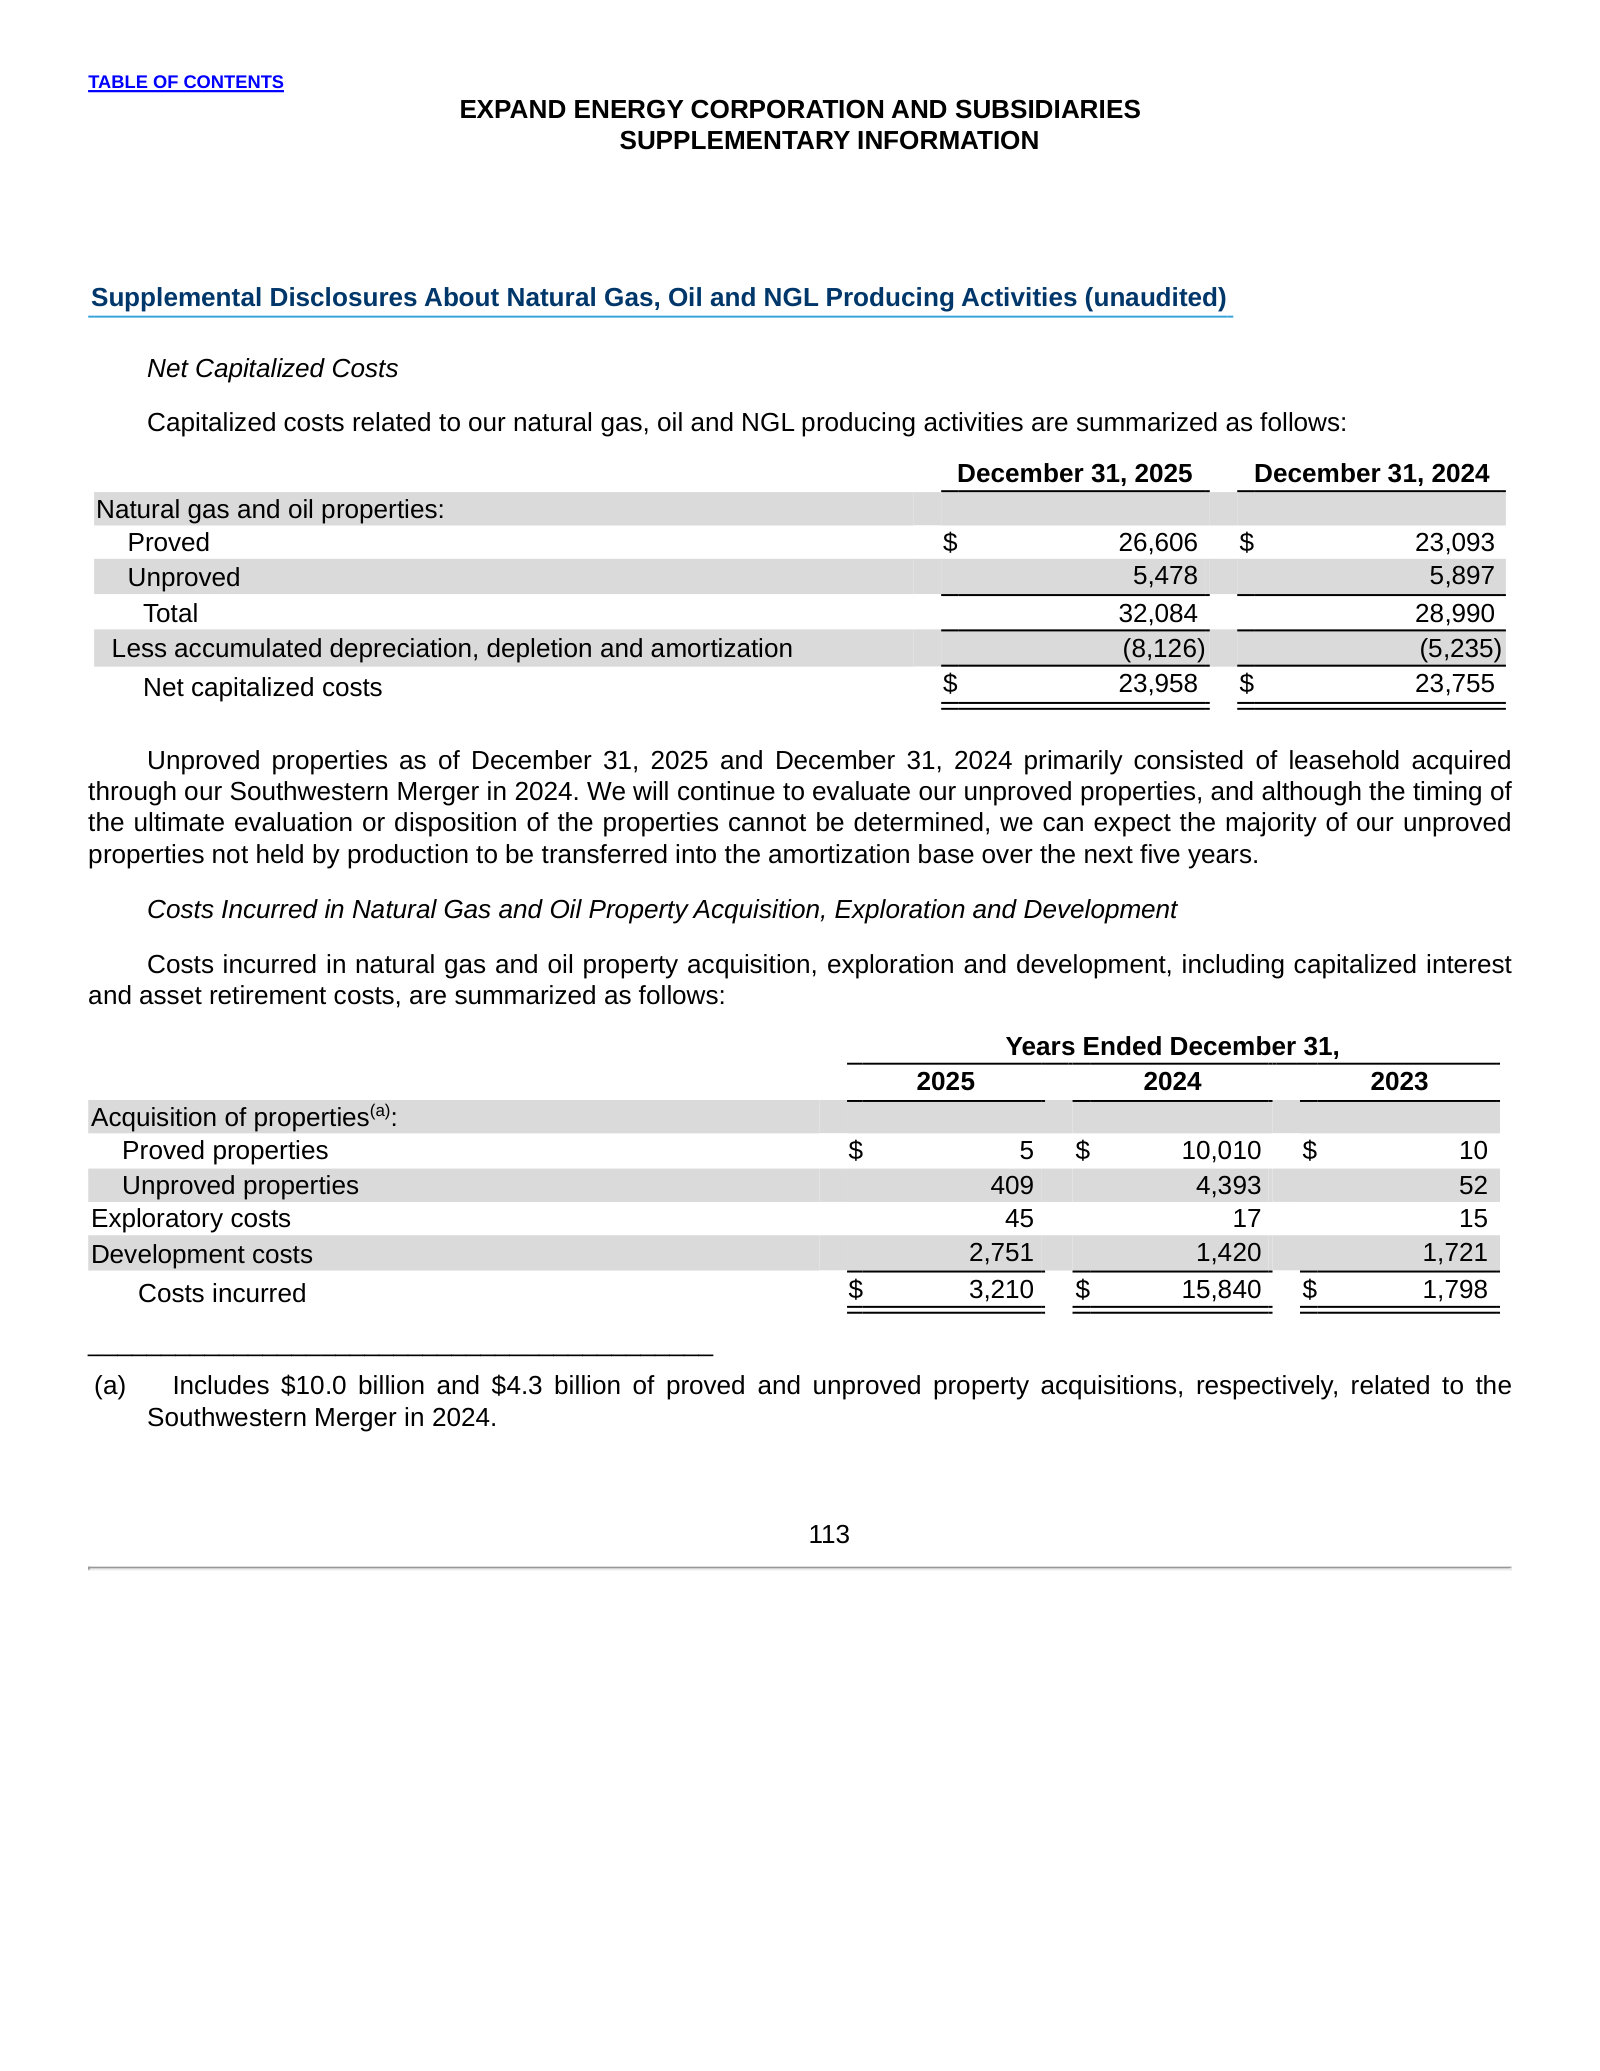
Supplemental Disclosures About Natural Gas, Oil and NGL Producing Activities (unaudited) — p. 165 · Read the full section →
The E&P-specific disclosures — capitalized costs, costs incurred, and the standardized-measure roll-forward.
Chesapeake Energy Corporation — FY2021 Annual Report (Form 10-K) — FY2021
The pre-merger identity: a freshly bankruptcy-exited, oil-and-gas Chesapeake — worth seeing against today's pure-gas Expand. · Open the full document →
Item 1. Business — p. 12 · Read the full section →
Chesapeake just out of Chapter 11 — 8,200 oil-and-gas wells, buying Vine/Chief, selling Powder River, refocusing on gas.
More annual reports
Expand Energy Corporation — FY2024 Annual Report (Form 10-K) — FY2024 · 192 pages · First 10-K under the Expand Energy name; the Southwestern merger closes and the rebrand takes effect. · Open →
Chesapeake Energy Corporation — FY2023 Annual Report (Form 10-K) — FY2023 · 223 pages · Last full year as standalone Chesapeake before the merger; Eagle Ford oil exit underway. · Open →
Chesapeake Energy Corporation — FY2022 Annual Report (Form 10-K) — FY2022 · 181 pages · Chief/Marcellus additions and Powder River sale complete the pivot to a three-basin gas producer. · Open →
Source: S&P Capital IQ consensus via Xpressfeed · Generated 2026-07-27.
The consensus tape is being marked down on earnings, not revenue: FY2027 normalized EPS has been cut roughly 12% over the past 90 days while the FY2027 revenue line held flat-to-higher. That out-year markdown coexists with a string of near-term beats — normalized EPS has topped consensus in seven of the last eight quarters. The Street stays buy-skewed with no sell ratings, but coverage thins quickly past FY2027 and the FY2027 EPS range is unusually wide.
FY2027 normalized EPS cut ~12% in 90 days while the revenue line held
The markdown sits in earnings, not revenue: FY2027 EPS is down across 30/90/180 days while FY2027 revenue is flat-to-higher. FY2028 shows a milder version of the same split.
Currency: USD · Scale: money in millions, absolute · Point-in-time consensus; Δ90d is Now versus 90d.
| Metric | FY | 180d | 90d | 30d | Now | Δ90d |
|---|---|---|---|---|---|---|
| EPS (normalized) | FY2027 | $10.07 | $9.45 | $9.50 | $8.36 | -11.6% |
| EPS (normalized) | FY2028 | $10.06 | $9.08 | $10.13 | $9.44 | +4.0% |
| Revenue | FY2027 | $10.05bn | $10.15bn | $10.33bn | $10.35bn | +2.0% |
| Revenue | FY2028 | $10.00bn | $10.49bn | $11.37bn | $10.81bn | +3.1% |
EPS beat in seven of the last eight quarters; revenue swung from misses to beats
The lone EPS miss was -4% in Q2 2025; the three most recent quarters all beat. Read against the out-year EPS cuts, the company is beating near-term while analysts trim later years.
Current sequences by metric: Revenue: 2 consecutive beats; EPS (normalized): 3 consecutive beats.
Currency: USD · Scale: money in millions, absolute · Consensus is captured before each actual first became effective.
| Quarter | Metric | Consensus | Actual | Surprise | Outcome |
|---|---|---|---|---|---|
| Q1 FY2026 | Revenue | $3.05bn | $3.31bn | +8.5% | Beat |
| Q1 FY2026 | EPS (normalized) | $3.63 | $3.83 | +5.4% | Beat |
| Q4 FY2025 | Revenue | $2.29bn | $2.31bn | +0.8% | Beat |
| Q4 FY2025 | EPS (normalized) | $1.89 | $2.00 | +5.9% | Beat |
| Q3 FY2025 | Revenue | $1.93bn | $1.85bn | -4.1% | Miss |
| Q3 FY2025 | EPS (normalized) | $0.85 | $0.97 | +14.3% | Beat |
| Q2 FY2025 | Revenue | $2.07bn | $2.02bn | -2.2% | Miss |
| Q2 FY2025 | EPS (normalized) | $1.15 | $1.10 | -4.1% | Miss |
| Q1 FY2025 | Revenue | $2.24bn | $2.30bn | +2.6% | Beat |
| Q1 FY2025 | EPS (normalized) | $1.87 | $2.02 | +8.0% | Beat |
| Q4 FY2024 | Revenue | $1.77bn | $1.59bn | -9.8% | Miss |
| Q4 FY2024 | EPS (normalized) | $0.47 | $0.55 | +17.5% | Beat |
| Q3 FY2024 | Revenue | $547.59m | $407.00m | -25.7% | Miss |
| Q3 FY2024 | EPS (normalized) | -$0.06 | $0.16 | +371.4% | Beat |
| Q2 FY2024 | Revenue | $603.12m | $378.00m | -37.3% | Miss |
| Q2 FY2024 | EPS (normalized) | -$0.02 | $0.01 | +163.0% | Beat |
Forward estimates
Currency: USD · Scale: money in millions, absolute · YoY uses the prior fiscal year from the feed; analyst count and range use the first displayed period.
| Metric | FY2026E | FY2027E | FY2028E | YoY | Analysts | Low / high |
|---|---|---|---|---|---|---|
| Revenue | $9.94bn | $10.35bn | $10.81bn | +17.3% | 8 | $9.36bn / $11.57bn |
| EBITDA | $5.92bn | $5.86bn | $6.14bn | +16.5% | 22 | $5.52bn / $7.16bn |
| EPS (normalized) | $8.44 | $8.36 | $9.44 | +38.3% | 21 | $7.50 / $9.64 |
| Free cash flow | $2.88bn | $2.61bn | $2.83bn | +44.6% | — | — |
Analysts split hard on FY2027: normalized EPS spans $4.78 to $18.37
With 22-23 analysts each, the FY2027 EPS and EBITDA ranges are too wide to be coverage noise — they reflect real disagreement on the out-year model.
Currency: USD · Scale: money in millions, absolute · Spread/mean is absolute high-low divided by absolute mean.
| Metric | Period | Mean | Low–high | Spread/mean | Analysts |
|---|---|---|---|---|---|
| EPS (normalized) | FY2027E | $8.36 | $4.78–$18.37 | 162.5% | 23 |
| EBITDA | FY2027E | $5.86bn | $4.70bn–$9.00bn | 73.2% | 22 |
| EBITDA | FY2028E | $6.14bn | $4.88bn–$9.10bn | 68.7% | 17 |
Street snapshot
17 buys and 3 outperforms against 6 holds and zero sells, a clearly buy-skewed book; targets range from $92 to $160.
Currency: USD · Scale: money in millions, absolute · Analyst counts shown explicitly.
| Street view | Reading | Analysts |
|---|---|---|
| Recommendation mix | Buy 17, Outperform 3, Hold 6, Underperform 0, Sell 0 | 26 |
| Consensus score | 1.58 | 26 |
| Target price | mean $124.1; median $124.0; high $160.0; low $92.00 | 25 |
Coverage thins fast past FY2027 and revenue is lightly modeled throughout
Revenue carries only 8 annual estimates even in current years, and outer-year coverage collapses to 5 analysts for FY2028 and 1 for FY2029 — treat those levels as indicative. EBITDA and EPS are far better covered at 20-plus.
Visible Alpha broker models via S&P Xpressfeed · 23 brokers · 484 line items · freshest revision 2026-07-26.
Visible Alpha's models frame Expand Energy as a scale gas producer with a clearing balance sheet: total output grows mid-single digits then slows, led almost entirely by the Haynesville, while Appalachia is held roughly flat. Modeled cash flow humps in FY-2026 and eases in FY-2027 with the Henry Hub curve before recovering, and net debt runs to zero by FY-2028 — shifting capital returns from deleveraging toward buybacks. Coverage is deep on the aggregates (20+ brokers) but thin on the basin and segment splits (5-10 brokers).
Haynesville drives modeled volume growth; Appalachia is held roughly flat
| Line | FY-2025A | FY-2026E | FY-2027E | FY-2028E | YoY | Brokers |
|---|---|---|---|---|---|---|
| Companywide | — | — | — | — | — | — |
| Gas equivalent production per day(Mmcfe) | 7.16m mcfe | 7.51m mcfe | 7.68m mcfe | 7.79m mcfe | +4.8% | 23 |
| By basin | — | — | — | — | — | — |
| Gas equivalent production per day - Haynesville(Mmcfe) | 3.01m mcfe | 3.22m mcfe | 3.31m mcfe | 3.41m mcfe | +6.9% | 11 |
| Gas equivalent production per day - Marcellus / Northeast Appalachia(Mmcfe) | 4.16m mcfe | 4.30m mcfe | 4.12m mcfe | 4.08m mcfe | +3.4% | 11 |
The gas-price deck is the real debate — Henry Hub spans $2.77-$4.12 in FY-2027
Henry Hub is the swing assumption here, and the FY-2027 deck ranges $2.77 to $4.12 across 20 brokers (median $3.50). That mid-curve dip — mean $3.70 in FY-2026 easing to $3.55 in FY-2027 — is what pulls modeled EBITDAX and free cash flow lower in FY-2027 before both recover in FY-2028.
| Line | Period | Median | Q1–Q3 | Min–max | Brokers |
|---|---|---|---|---|---|
| Henry Hub : Natural Gas($) | FY-2026E | $3.67 | $3.61–$3.74 | $3.54–$4.00 | 20 |
| Henry Hub : Natural Gas($) | FY-2027E | $3.50 | $3.41–$3.75 | $2.77–$4.12 | 20 |
| Henry Hub : Natural Gas($) | FY-2028E | $3.75 | $3.66–$4.00 | $3.46–$4.12 | 16 |
| Natural gas price ex. hedging($) | FY-2027E | $3.20 | $3.13–$3.42 | $2.58–$3.71 | 18 |
Deleveraging is nearly done — models pivot cash toward buybacks, net cash by FY-2028
| Line | FY-2025A | FY-2026E | FY-2027E | FY-2028E | YoY | Brokers |
|---|---|---|---|---|---|---|
| Cash flow | — | — | — | — | — | — |
| Free cash flow - Analyst published | $1.98bn | $2.89bn | $2.62bn | $2.82bn | +45.6% | 17 |
| Balance sheet | — | — | — | — | — | — |
| Net debt | $4.06bn | $2.07bn | $764.75m | $-635.32m | -49.1% | 11 |
| Returns | — | — | — | — | — | — |
| Share repurchase-CF | $103.93m | $598.28m | $795.23m | $842.37m | +475.7% | 19 |
| Cash dividend paid | $797.25m | $606.49m | $690.52m | $667.85m | -23.9% | 19 |
Per-Mcfe cost stack: the one clear trend is falling interest expense
The cost stack is steady — DD&A near $1.10 and production costs around $0.25 per Mcfe — with the one clear trend being interest expense falling from $0.089 to $0.057 per Mcfe across FY-2025 to FY-2028 as debt comes down. Coverage on these lines is deep, at up to 22 brokers.
| Line | FY-2025A | FY-2026E | FY-2027E | FY-2028E | YoY | Brokers |
|---|---|---|---|---|---|---|
| Oil natural gas and NGL production per Mcfe($) | $0.24 | $0.26 | $0.25 | $0.25 | +6.0% | 23 |
| D,D & A per Mcfe($) | $1.13 | $1.10 | $1.12 | $1.12 | -2.0% | 23 |
| General and administrative per Mcfe($) | $0.07 | $0.09 | $0.08 | $0.09 | +19.7% | 23 |
| Production taxes per mcfe($) | $0.08 | $0.08 | $0.08 | $0.09 | -0.9% | 23 |
| Interest expense per mcfe($) | $0.09 | $0.07 | $0.06 | $0.06 | -20.3% | 22 |
Basin and segment splits rest on far fewer brokers than the aggregates
Headline aggregates — total production, prices, EBITDAX — carry 17-23 brokers, but the differentiated lines are thinner: basin volumes and capex on 5-11, segment revenue on 5-8, and net debt on 10. Treat the basin and segment splits as a handful of models, not a settled consensus.
Headline P&L consensus, momentum and beat/miss live in the CapIQ tab.
Source: S&P Capital IQ transcripts via Xpressfeed · latest indexed call 2026-04-29 · generated 2026-07-27.
Latest call digest
Expand Energy Corporation, Q1 2026 Earnings Call, Apr 29, 2026 · 2026-04-29T13:00:00
Q1 2026 call (Apr 29, 2026) — the first call with a permanent new CFO, Marcel Teunissen (ex-Shell), and the second call run by Chairman Mike Wichterich as Interim President & CEO after Nick Dell'Osso's departure. Prepared remarks were confident and demand-led: Wichterich said he is "more optimistic today about our industry and company than ever," pointing to AI power, reshoring and LNG. Financially, the quarter generated roughly $1.7 billion of free cash flow (inclusive of working-capital inflows), was used to cut gross debt by about $1.3 billion and return over $290 million to shareholders; full-year production (7.5 Bcf/d) and capital ($2.85 billion) guidance were left unchanged. The headline commercial news was a new offtake SPA with Delfin LNG for 1.15 mtpa, replacing a previously terminated agreement, and continued framing of a ~$0.20 margin-uplift program (~$500 million of repeatable free cash flow) across three buckets: reaching premium markets, monetizing volatility (about $90 million captured in Q1), and facilitating new demand. Western Haynesville results were called encouraging but early, with a second well spud.
The Q&A reality was more skeptical and centered on the transition. Analysts pressed the new CFO on the right capital structure and whether buybacks make sense with the corporate breakeven still above spot gas; on the CEO-search timeline (Wichterich called himself "at the money" on his ~6-month prediction, targeting an energy executive); and on how much of the $0.20 is near-term versus dependent on longer-dated, not-yet-FID'd LNG/power deals. Management held guidance and leaned toward rebalancing the rest of 2026's free cash flow from debt paydown toward buybacks.
Participant coverage from the latest call.
| Group | Participants | Count |
|---|---|---|
| Management | Operator; Brittany Raiford — Vice President of IR & Treasurer, Expand Energy Corporation; Michael Wichterich — Chairman of the Board, Interim President & CEO, Expand Energy Corporation; Daniel Turco — Executive Vice President of Marketing & Commercial, Expand Energy Corporation; Marcel Teunissen — Executive VP, CFO, Principal Accounting Officer, Expand Energy Corporation; Josh Viets — Executive VP & COO, Expand Energy Corporation | 6 |
| Analysts | Matthew Portillo — Partner and Head of Research, Tudor, Pickering, Holt & Co. Securities, LLC, Research Division; Douglas George Blyth Leggate — MD & Senior Research Analyst, Wolfe Research, LLC; Kevin MacCurdy — Director of Research, Pickering Energy Partners Insights; Neil Mehta — VP and Integrated Oil & Refining Analyst, Goldman Sachs Group, Inc., Research Division; Scott Hanold — MD and U.S. Exploration & Production Analyst, RBC Capital Markets, Research Division; John Freeman — MD & Research Analyst, Raymond James & Associates, Inc., Research Division; Zachary Parham — Research Analyst, JPMorgan Chase & Co, Research Division; Phillip Jungwirth — U.S. Energy Analyst, BMO Capital Markets Equity Research; Neal Dingmann — Research Analyst, William Blair & Company L.L.C., Research Division; Charles Meade — Analyst, Johnson Rice & Company, L.L.C., Research Division | 10 |
Curated latest-call exchanges; one row per analyst topic.
| Analyst | Firm | Topic | What changed in Q&A |
|---|---|---|---|
| Matthew Portillo | TPH | New Delfin LNG SPA & global gas balances | Opened on why Delfin was attractive; management casts LNG as an extension of the Haynesville to reach international (JKM/TTF) pricing and premium markets. |
| Douglas Leggate | Wolfe Research | New CFO & capital structure / buybacks vs delever | Welcomed CFO Marcel Teunissen and pressed whether buybacks make sense with breakeven still above spot gas; management frames buybacks as opportunistic and leans toward rebalancing toward buybacks after the Q1 debt paydown. |
| Neil Mehta | Goldman Sachs | CEO search progress | Asked for a 'mark-to-market' on the search; Wichterich says the ~6-month timeline is unchanged, wants an energy person, and stresses the team is 'not waiting' for a permanent CEO. |
| Kevin MacCurdy | Pickering Energy Partners | Leading-edge well costs & Western Haynesville | First Western Haynesville well online since early March described as encouraging but early; a second well spud ~50 miles north; costs stable outside near-term diesel inflation. |
| Zach Parham | JPMorgan | Activity flexibility at lower strip & debt-vs-buyback | Pressed on moderating activity if the strip weakens and on use of incremental free cash flow; management reiterates flexibility to defer TILs and rebalancing remaining-year cash toward buybacks. |
Theme tracker
Themes are curator-classified across supplied calls.
| Theme | Status | Quarters mentioned | Read-through |
|---|---|---|---|
| Marketing / 'beyond the wellbore' margin uplift (~$0.20) | emerged | Q3 2025, Q4 2025, Q1 2026 | What began as LNG-ready optionality escalated into a headline commercial program: a ~$0.20 margin uplift (~$500 million of repeatable free cash flow) across premium markets, monetizing volatility, and capturing new demand. Under new interim leadership it drove an HQ relocation to Houston to build out marketing and trading. |
| Productive-capacity flexibility (defer TILs, build DUCs, curtail) | persisted | Q2 2023, Q4 2023, Q1 2024, Q3 2024, Q4 2024, Q1 2025, Q3 2025, Q1 2026 | The most durable operating theme: match supply to demand by deferring turn-in-lines, building DUCs and curtailing, rather than chasing spot price. Consistent from the Chesapeake era through Expand, now expressed as the ability to flex around a 7.5 Bcf/d target. |
| Chesapeake–Southwestern merger synergies | persisted | Q3 2024, Q4 2024, Q1 2025, Q2 2025, Q3 2025 | Synergy targets were raised repeatedly (original $400M, to $500M by 2025, then $500M/$600M for 2025/2026, and ~50% above the original target by Q3 2025). The language recedes by Q4 2025/Q1 2026 as marketing and AI-driven 'self-help' take over the narrative. |
| Haynesville breakeven reduction | persisted | Q4 2024, Q1 2025, Q2 2025, Q3 2025, Q1 2026 | A recurring analyst and management focus; the stated breakeven moved from around $3 toward below $2.75 in the Haynesville, aided by drilling efficiency, a self-owned sand mine and higher proppant intensity. |
| LNG / premium-market diversification | persisted | Q2 2023, Q3 2023, Q4 2023, Q4 2024, Q3 2025, Q4 2025, Q1 2026 | Evolved from JKM-linked HOAs (Gunvor, Vitol, Delfin) and a 15–20% LNG target to a premium-market-agnostic stance, the Lake Charles Methanol supply deal, and a new, larger Delfin SPA. |
| Balance-sheet deleveraging priority | persisted | Q3 2024, Q4 2024, Q1 2025, Q2 2025, Q3 2025, Q4 2025, Q1 2026 | Post-merger, debt reduction was formalized as a priority tranche; the 2025 target rose from $500 million to $1 billion, and Q1 2026 reported roughly $1.3 billion of gross-debt reduction and peer-leading leverage. |
| AI / power-generation demand | emerged | Q2 2024, Q3 2024, Q1 2025, Q2 2025, Q1 2026 | First surfaced as data-center curiosity in 2024 and grew into a core demand pillar alongside LNG, framed around Appalachia (PJM) power and Gulf Coast industrial growth. |
| Eagle Ford exit | dropped | Q2 2023, Q3 2023, Q4 2023, Q1 2024 | A prominent portfolio-cleanup topic through the divestiture; once completed it disappears entirely from the narrative, consistent with a finished, non-recurring event rather than lost interest. |
| Leadership transition (CEO/CFO turnover, Houston HQ) | emerged | Q4 2025, Q1 2026 | The merger's architect Nick Dell'Osso departed as CEO and Mike Wichterich stepped in as interim; CFO Mohit Singh had also exited (last on the Q2 2025 call), with Marcel Teunissen named CFO by Q1 2026. The change coincides with the marketing pivot and the move to Houston. |
Guidance ledger
Quotes, calls, and speakers are source-verified; outcomes are curator-classified.
| Verbatim guidance | Call | Speaker | Curator outcome | Outcome note |
|---|---|---|---|---|
| “We now expect to achieve approximately $400 million of our annual synergy target in 2025 and to capture the entire $500 million target by year-end 2026.” | Expand Energy Corporation, Q4 2024 Earnings Call, Feb 27, 2025 · 2025-02-27T14:00:00 | Domenic Dell'Osso | kept | Later raised: Q2 2025 lifted the target to roughly $500 million in 2025 and $600 million in 2026, and by Q3 2025 management cited synergies about 50% above the original goal. |
| “we expect to allocate $500 million to debt reduction in 2025.” | Expand Energy Corporation, Q4 2024 Earnings Call, Feb 27, 2025 · 2025-02-27T14:00:00 | Domenic Dell'Osso | kept | The 2025 net-debt-reduction target was later raised to $1 billion (Q2 2025); Q1 2026 reported a roughly $1.3 billion gross-debt reduction. |
| “we are prepared to deliver 7.5 Bcf per day of production for approximately the same CapEx spent in 2025.” | Expand Energy Corporation, Q3 2025 Earnings Call, Oct 29, 2025 · 2025-10-29T13:00:00 | Domenic Dell'Osso | pending | Reaffirmed through Q1 2026 (7.5 Bcf/d at $2.85 billion capex); full-year 2026 results not yet in the supplied call history. |
| “We now expect to recognize approximately a 50% increase to annual synergies realizing $500 million and $600 million in 2025 and 2026, respectively.” | Expand Energy Corporation, Q2 2025 Earnings Call, Jul 30, 2025 · 2025-07-30T13:00:00 | Domenic Dell'Osso | pending | The 2025 leg was reaffirmed and characterized as running ahead by Q3 2025; the 2026 leg is not yet confirmed in the supplied calls. |
| “about $0.20 of margin improvement, which equates to approximately $500 million of repeatable incremental free cash flow per year.” | Expand Energy Corporation, Q1 2026 Earnings Call, Apr 29, 2026 · 2026-04-29T13:00:00 | Michael Wichterich | pending | Framed as a 3-to-5-year target; management says it does not require one transformational deal, but the bulk depends on commercial deals still to be signed. |
| “we expect to deliver 7.5 Bcf a day at $2.85 billion of CapEx.” | Expand Energy Corporation, Q1 2026 Earnings Call, Apr 29, 2026 · 2026-04-29T13:00:00 | Josh Viets | pending | Full-year 2026 target reiterated with Q2 the capex high point; outcome not yet observable in the call history. |
Q&A pressure map
Question counts and firms are curator tallies; analyst coverage shown above.
| Topic | Questions | Firms | Pressure / response |
|---|---|---|---|
| Marketing / commercial '$0.20' uplift: size, timing and credibility | 7 | Goldman Sachs, TPH, UBS, Raymond James, Barclays, ROTH, William Blair | The heaviest cluster on the two most recent calls. Management holds to the ~$0.20 / ~$500 million figure over 3–5 years, but analysts repeatedly test how it was derived, how much is near-term versus dependent on unsigned LNG/power deals, and whether it is a stretch. |
| Capital allocation: debt paydown vs buybacks and variable dividends | 8 | JPMorgan, Wolfe Research, Goldman Sachs, Barclays, RBC Capital Markets, Citigroup | Persistent every quarter post-merger. Management consistently puts the balance sheet first and calls buybacks 'opportunistic,' resisting prescriptive commitments; Leggate in particular probes whether buying stock makes sense with gas below breakeven. |
| Breakeven trajectory and capital efficiency | 6 | Wolfe Research, Goldman Sachs, Johnson Rice, Mizuho, BMO | Leggate presses nearly every call to 'pin down' the breakeven number; management walks it from around $3 to below $2.75 in the Haynesville, crediting drilling speed, self-sourced sand and productivity. |
| Western Haynesville appraisal risk | 5 | Pickering Energy Partners, RBC Capital Markets, TD Cowen, Johnson Rice | Analysts probe well cost, long-term decline and how large the play could become; management repeatedly answers 'early' and 'methodical,' emphasizing option value given 20+ years of core inventory. |
| CEO / leadership transition | 3 | Goldman Sachs, Wolfe Research | Analysts ask about the search characteristics, timeline and the incoming CFO; management gives a ~6-to-9-month timeline and stresses continuity and 'not waiting.' Notably, no question in the supplied calls elicits — and management does not volunteer — the reason for Nick Dell'Osso's departure. |
Language shifts
Only language evidence verified against the referenced component is shown.
| Observation | Verbatim evidence | Call ID | Component |
|---|---|---|---|
| Marketing reframed from defense to offense while Dell'Osso was still CEO, foreshadowing the later pivot. | “This announcement is also a great example of the evolution of our marketing strategy from value protection to value creation.” | 1966193794 | 2 |
| New interim CEO introduces a sharper strategic framing that treats drilling as no longer sufficient on its own. | “We have to think beyond the wellbore.” | 1982591546 | 2 |
| Unusually candid self-criticism, a shift from the prior uniformly upbeat register, admitting shortfall on capturing new demand. | “we have not made as much progress, and we're disappointed in and we expect to do better” | 1982591546 | 2 |
| Management directly addresses the leadership-vacuum concern rather than deflecting it. | “We are not waiting for a new CEO to show up before we act.” | 1995595241 | 58 |
The call history shows a company that delivered a large, well-executed merger and drove costs and breakevens down convincingly, then — through abrupt CEO and CFO turnover — recast its story from operational self-help toward a marketing/'beyond the wellbore' margin program whose ~$500 million payoff is largely three-to-five years out and still unproven. For the debate, near-term execution (production, deleveraging, opportunistic buybacks) is well established; the open question is whether new leadership can convert commercial ambition into repeatable cash flow.
Competitors describe Expand Energy Corporation's market in their own filings and calls. These verified passages and visual pages show where their strategies meet, using source documents preserved in Sources.
EQT Corporation (EQT)
The other contender for 'largest U.S. natural gas producer' and Expand's most direct Appalachian rival: a vertically integrated Marcellus/Utica operator chasing the same power, data-center and LNG demand, and Expand's nearest comparison on scale, cost and marketing reach.
EQT's headline self-positioning — it claims to be the 'only large-scale, integrated' U.S. gas producer, the exact scale-and-integration ground Expand contests as the largest producer by volume, and names the same demand vectors (power, data centers, LNG).
As the only large-scale, integrated natural gas producer in the United States, we believe we are well positioned to excel during times of market volatility and to serve growing sources of demand, including power generation, industrial consumption, domestic data center development and LNG exports.
p. 11 · Read in context →
On its Q4 2025 call EQT ranks itself the second-largest gas marketer in the U.S. 'ahead of all upstream and midstream peers' — a commercial/marketing-scale claim against the peer set that includes Expand.
[…] position as the second-largest marketer of natural gas in the U.S. ahead of all upstream and midstream peers, coupled with persistent price volatility means our marketing optimization efforts should have recurring positive impacts on financial performance going forward.
p. 2 · Read in context →
EQT sizes the long-run international gas opportunity (+200 Bcf/d to 2050) and defines the moat it says gates access — low cost, decades of inventory, investment-grade balance sheet — the same qualifiers Expand's scale thesis rests on.
We expect natural gas demand outside the U.S. to rise by 200 Bcf per day between now and 2050, highlighting the tremendous opportunity for U.S. producers that can directly access international markets. However, that access will only be available to producers that have the combination of low-cost structure, multiple decades of quality inventory, an investment-grade balance sheet, and strong environmental attributes, all of which are hallmarks of the differentiated platform we have built at EQT.
p. 3 · Read in context →
Antero Resources Corporation (AR)
A core Appalachian (Marcellus/Utica) gas-and-NGL producer overlapping Expand's Southwestern-legacy West Virginia acreage; Antero presses a low-cost, high-LNG/NGL-export book as the differentiated Appalachian model against which Expand's post-merger position is measured.
Antero's stated export leverage: it claims the highest LNG exposure among Appalachian producers (2.3 Bcf/d to the LNG fairway) and the top U.S. NGL-exporter position — the premium-market access Expand also targets from Appalachia and the Haynesville.
We have the highest LNG exposure among Appalachian producers, selling 2.3 Bcf per day of production to sales points along the LNG fairway. At the same time, we are the largest producer-exporter of NGLs in the U.S., selling the majority of our LPG, which includes propane and butane, into international markets.
p. 2 · Read in context →
Antero's share claim in the basin it shares with Expand's Southwestern-legacy assets — it says it produces about half of West Virginia's natural gas across nearly a million acres, framing itself as the consolidator there.
We are the dominant energy producer in West Virginia. We produce about half of the natural gas in the state, have close to almost 1 million acres there, and decades’ worth of inventory. We are the West Virginia energy producer.
p. 7 · Read in context →
Antero's own peer-relative cost claim — the lowest maintenance capital per Mcfe in its peer group at $0.53, 27% below the peer average — the capital-efficiency benchmark Expand's low-cost scale story is judged against.
Antero has the lowest maintenance cap per Mcfe of its peer group at just $0.53 per Mcfe. This is 27% below the peer average of $0.73 per Mcfe.
p. 1 · Read in context →
Comstock Resources, Inc. (CRK)
The Haynesville pure-play that overlaps Expand's Louisiana/East-Texas Haynesville-Bossier business directly; majority-owned by Jerry Jones, Comstock is pioneering the Western Haynesville and locking Gulf-Coast LNG and data-center offtake in Expand's own supply corridor.
Comstock's framing of the Haynesville as 'the most important basin' for Gulf-Coast LNG and Texas/Louisiana data centers, with the Western Haynesville as the 'game changer' — the same basin thesis that underpins Expand's Haynesville-Bossier position.
The Haynesville shale is viewed, in our opinion, as the most important basin to supply natural gas to Gulf Coast LNG facilities and now the data centers being built in Texas and Louisiana. The arrival of the Western Haynesville is the game changer as the market looks into the future to where the needed natural gas will come from.
p. 5 · Read in context →
Comstock's stated data-center supply win — a DOC-selected 5.2 GW gas-fired hub on its Western Haynesville acreage that it would supply with up to ~1 Bcf/d by 2031 — the kind of direct producer-to-load offtake Expand competes for in the same corridor.
On March 19, 2026, the United States Department of Commerce selected our Western Haynesville site to host a new 5.2 gigawatt natural gas fired power generation hub to be located in Anderson County, Texas […] Comstock Resources, Inc. will provide the natural gas supply for the facility, which could reach almost 1 billion cubic feet per day by 2031.
p. 1 · Read in context →
Comstock quantifies its Western Haynesville inventory (3,331 gross / 2,546 net locations, ~76% WI, Bossier-weighted) — the drilling-runway scale claim in the play that overlaps Expand's Haynesville-Bossier acreage.
Our Western Haynesville inventory currently consists of 3,331 gross locations and 2,546 net locations, which equates to an average working interest of approximately 76%. The number of our net locations is estimated since much of our Western Haynesville acreage has not yet been unitized. Our Western Haynesville inventory is more weighted to the Bossier formation with nearly two-thirds of the inventory in the Bossier shale and one-third of the inventory in the Haynesville shale.
p. 3 · Read in context →
Range Resources Corporation (RRC)
An original Marcellus operator and low-decline Appalachian gas-and-NGL producer; Range is the one peer that names Expand Energy directly — slotting it among the six 'dry gas' companies it benchmarks itself against.
Range names Expand Energy directly — both in its 13-company self-constructed peer index and again among the six highest-dry-gas-reserve peers weighted double — an explicit statement that it benchmarks itself against Expand.
The 2025 Self-Constructed Peer Group includes the SPDR S&P Midcap 400 and the SPDR S&P Oil and Gas E&P ETF and the following thirteen companies: Antero Resources Corporation, Civitas Resources, Inc., Chord Energy Corporation, CNX Resources Corporation, Comstock Resources, Inc., Coterra Energy, Inc., EQT Corporation, Expand Energy Corporation, Magnolia Oil & Gas Corporation, Matador Resources, Murphy Oil, Ovintiv Inc. and SM Energy Company. The 2025 Self-Constructed Peer Group is a market capitalization-weighted index in which each of the six Compensation Peer Group companies with the highest percentage of dry gas reserves are included twice. The six companies included twice are Antero Resources Corporation, CNX Resources Corporation, Comstock Resources, Inc., Coterra Energy Inc., EQT Corporation and Expand Energy Corporation.
p. 69 · Read in context →
Range's read of the gas macro in its 10-K — rising LNG exports plus supply-side constraints (infrastructure limits, moderated reinvestment, core-inventory exhaustion) — the demand/supply backdrop Expand's equity story also invokes.
natural gas prices increased primarily due to increased exports from new U.S. LNG export facilities. Longer term natural gas futures prices remain constructive based on market expectations that associated gas-related activity in oil basins and dry gas basin activity will show modest rates of growth due to infrastructure constraints, moderated reinvestment rates and core inventory exhaustion. In addition, the global energy shortage experienced in recent years further highlighted the need for affordable and reliable fuel sources, supporting continued strong structural demand growth for United States LNG exports, as well as domestic electricity generation.
p. 72 · Read in context →
Range's inventory-depth claim — an estimated 27 million lateral feet of Marcellus drilling inventory — the runway metric on which Appalachian scale, including Expand's, competes.
Currently, we have an estimated 27 million lateral feet of drilling inventory remaining in the Marcellus Shale, both proved and unproved.
p. 15 · Read in context →
Coterra Energy Inc. (CTRA)
A diversified Permian-oil plus Marcellus-gas producer that runs its Marcellus as a swing asset — curtailing and adding gas volumes with price. That discretionary supply, plus a low well-cost structure, makes Coterra a source of the Appalachian volume Expand must sell into.
Coterra's Marcellus cost claim — a record $800-per-foot structure driven by 60%-longer laterals — the well-cost benchmark that lets it compete on Appalachian gas economics with Expand.
The teams delivered by providing us with a highly efficient plan in 2025 that is anchored by a record low-cost structure of $800 per foot. This dramatic reduction in cost structure is anchored by structural changes and includes the reengineering of upcoming projects, which increased our average lateral length by 60% compared to the prior plans.
p. 4 · Read in context →
Coterra describes its Marcellus as a price-responsive swing asset — adding activity and capital as gas fundamentals improve, with flexibility to raise investment mid-year — the discretionary Appalachian supply that competes with Expand's volumes.
At the same time, we've added activity and capital in the Marcellus, reflecting improved natural gas fundamentals and a lower cost structure. We have the flexibility, if warranted, to increase our investment later in the year while staying within our guidance range.
p. 2 · Read in context →
Gulfport Energy Corporation (GPOR)
A leaner Utica/Marcellus (and SCOOP) gas producer in Expand's Appalachian backyard; several of its executives are ex-Chesapeake. Gulfport frames a low-breakeven, inventory-deep organic model as the disciplined alternative to Expand-scale consolidation.
Gulfport's inventory-and-economics claim — ~700 gross locations, ~15 years of net inventory and 'peer-leading' sub-$2.50/MMBtu breakevens — the low-cost Appalachian position it sets against larger peers like Expand.
Collectively, these initiatives have increased our gross undeveloped inventory by more than 40% since year-end 2022, and we now estimate Gulfport holds approximately 700 gross locations across our asset base. […] our total net inventory to roughly 15 years, with peer-leading breakevens below $2.50 per MMBtu.
p. 1 · Read in context →
Gulfport's response to Appalachian consolidation — acknowledging 'recent developments in Appalachia' while defending its disciplined organic strategy — a direct read on the M&A wave that produced Expand.
You're likely aware of some recent developments in Appalachia. We've maintained a disciplined approach in recent years, and our strategy has proven effective. I expect this will continue.
p. 11 · Read in context →
More peer documents
EQT Q1 FY2026 call — Appalachian power/data-center demand and 'preferred partner' claim — 13 pages · EQT raises its Appalachian power-demand base case toward 10 Bcf/d and claims 'preferred partner' status for large-scale power and data-center projects — direct positioning in Expand's core basin. · Open →
Antero Q4 FY2025 call — scale as a barrier to smaller West Virginia E&Ps — 13 pages · Management argues its size and surrounding footprint make it hard for smaller operators to develop — the consolidation dynamic in the basin Expand also contests. · Open →
Comstock Q3 FY2025 call — 'unicorn' inventory and owned Western Haynesville midstream — 13 pages · Comstock frames ~2,600 net Western Haynesville locations and proprietary midstream (direct-to-end-user sales) as a structural edge — useful context on how it competes in Expand's Haynesville. · Open →
Coterra Q2 FY2025 call — CEO on industry oversupply risk and gas discipline — 14 pages · Tom Jorden frames the 'relatively oversupplied' gas market if all producers run flat-out, and Coterra's tactical restraint — the supply-discipline debate that governs Appalachian gas prices. · Open →
Gulfport Q2 FY2025 call — AI/LNG-driven Northeast gas demand and in-basin power deals — 10 pages · Gulfport describes engaging on in-basin power-plant supply as AI/data-center demand rises in the Northeast — the same Appalachian monetization Expand pursues. · Open →
Fit
Does not fit the framework (P1 not met); contested: X1, X2, X3, X4, S1.
Expand Energy clears the universe (U.S.-listed on Nasdaq, ~$22.0B market cap) and trips no disqualifying exclusion, but it fails the one pure gate: the year-10 durability test. A commodity price-taker whose free cash flow ran from $8M to $2,302M in six years, and whose predecessor went through the last down-cycle in Chapter 11, cannot support "year-10 adjusted FCF higher, with very high conviction." Confidence is low — the name-mask probe flipped the exclusion labels, so a prior_driven_risk flag stands. Five criteria (X1, X2, X3, X4, S1) are recorded contested.
The answer, in one screen
The gate decides it. Everything below the gate — the setup, the yield, the balance sheet, the diagnosis — is real analysis, and some of it is favourable, but none of it offsets a failed P1. That is the framework's own rule: P1 not_met -> does_not_fit (gate; nothing offsets it).
Market cap ($B)
Adjusted FCF yield
Moderate-class bar
Trial P(temporary)
Sources: market cap and adjusted yield derived from company filings and market data (fit_features); the trial probability from the report's adversarial diagnosis trial. Adjusted FCF = reported FCF − stock-based comp − 5-yr avg acquisition spend.
Universe and exclusions
Universe — clears both lines. Expand Energy is ordinary U.S. common stock listed on Nasdaq under EXE, incorporated in Oklahoma, with principal offices in Oklahoma City and all operations onshore in the United States [1] — not an ADR, not a Chinese issuer, so U1 passes. At the $91.52 close on 2026-07-24 the ~240.37M shares put market cap near $22.0B, 2.2x the $10B floor; U2 passes even though the stock sits ~29% below its December 2025 peak.
Exclusions — none fires, but each is recorded contested. The company is a natural-gas exploration-and-production business, not an auto manufacturer (X1 does not apply) [2]. It trades near 1.8x sales and ~5x EV/EBITDA on a drawdown chart, the opposite of an extreme multiple-to-sales darling, so the consensus-saturated-story exclusion X4 does not trigger [3]. Operations are entirely onshore and gas sells at U.S. index prices; China appears in the 10-K only as generic "China-Taiwan relations" geopolitical risk, so the S1 China-dependence sensitivity is effectively zero [4].
Here is the decisive point about the "contested" label: it is not disagreement about the facts. On X1, X2, X3, X4 and S1 both model families concluded the exclusion does not fire — one family recorded that as not_met, the other as not_hit. The tally treats the differing labels as contested and, combined with the name-mask flip, that is what pins confidence at low. No juror found Expand to be an auto company, a promotional-CEO story, a structurally declining business, a saturated darling, or China-dependent.
Pattern match
Of the framework's four setups, Expand is closest to cyclicals at the bottom — a large, essential, capital-heavy producer priced off a soft commodity strip. But it fails that pattern's own entry checks. The precedent (large banks whose loss-rate data contradicts the macro fear) turns on mean-reverting fundamentals plus capitulation; here the fear gauge never reached capitulation (peak volume only 1.43x normal, see the Dislocation tab), and the "cyclical bottom" is a commodity price the company does not control rather than a mis-forecast that reprices. It is emphatically not the healthcare/insurance forecasting-error pattern (no 1:1 guidance-cut anchor) and not a quality tech monopoly on a fear dip (no monopoly, no franchise pricing power). It fits none of the four cleanly.
The pillar ledger
Source: deterministic fit tally; per-criterion arithmetic from the surviving claim ledgers cited in each section below.
Year-10 gate (P1) — the decisive result
Not met, unanimously. All four jury seats and the name-masked seat returned not_met; the trimmed-mean year-10 probability is 0.435 with a spread of 0.06 — cross-family agreement, tight. Year-10 revenue is plausibly higher on the LNG/power/industrial demand build and rising production (1,335 Bcfe in 2023 to 2,622 Bcfe in 2025). What cannot be asserted with very high conviction is year-10 adjusted free cash flow: reported FCF ran $22M (2020), $1,140M, $2,302M, $551M, $8M, $1,839M (2025) — a ~288x span [5] — because the number is set by an unforecastable Henry Hub price, and the predecessor filed Chapter 11 in 2020 [6]. Two of the framework's five conviction sources are genuine — natural gas is an essential product, and the business is capital-heavy ($24.4B net property, plant and equipment on $28.3B assets, an investment-grade survival barrier). But the market-structure source fails: at ~6% of U.S. output Expand is the largest producer yet still a price-taker with no regulatory entry barrier [7], and the long-operating-history source is qualified by a 2021 fresh-start reset and the October 2024 Southwestern merger [8]. Under the framework, any proper doubt resolves the gate to not met. Full treatment: the Durability tab.
Strongest counter-fact: consensus free cash flow of roughly $2.6B-$2.9B a year across FY2026-FY2029 sits above the current figure, and the demand tailwind (LNG export growth, coal retirements, data-center load) is structural [9]. It moves the volume question; it does not settle the price, and no consensus estimate extends to year 10.
FCF consistency (P2) — not met
The deterministic fcf_stability feature is not_computable (stock-based comp absent from the feed), so the test was run by hand on reported FCF [10]. The rolling five-year average moved 45% between the only two post-emergence windows ($805M for FY2020-24 to $1,168M for FY2021-25). Real acquisition cash ($1,967M in 2022, $459M in 2024) would push a properly adjusted weakest year negative. That is unpredictable, not the healthy every-5-to-8-years cadence the framework tolerates for insurers and banks. Detail on the Yield tab. Counter-fact: no reported year in the window was negative, and consensus projects a steadier $2.6B-$2.9B ahead.
Dislocation and yield (P3a, P3b, P3c, P3d)
The setup is soft. The only dated adverse event is the 9 February 2026 CEO exit and Houston-relocation announcement (a −6.5% session on 2.16x volume); the rest of the ~29% peak-to-trough fall tracks a weak gas tape, so P3a is not met. The capitulation gauge topped at 1.43x normal volume against a ≥2x reference line, so P3b is not met — 1.43x is well short of true fear (Dislocation). On valuation, the framework-adjusted FCF yield computes to 5.6% — 440 bps below the 10% moderate-class bar — because a $563M five-year-average acquisition charge dominates the adjustment; P3c is not met [11]. The balance-sheet class is moderate (net debt $4,393M / ~$5.0-5.5B EBITDA = 0.8-0.9x), so the 10% bar — not the 25% levered bar — applies [12]. The forward path is the favourable leg: consensus forward FCF yield runs 11.5-13.1% on the current market cap, clearing the bar unadjusted, so P3d is met at p=0.585 (spread 0.04) [13]. Counter-fact and the honest limit: mid-cycle normalized adjusted yield lands at 9.6%-11.2%, straddling the bar — it clears 10% only if Expand is finished as a serial acquirer and if Henry Hub averages ~$3.50+, neither of which the company controls (Yield).
Balance sheet and self-help (P4a, P4b, P4c)
Outlast (P4a): met. Investment-grade at ~0.8x leverage, no note maturities before 2029, a fully undrawn $3.5B revolver [14]. Capital allocation was pointed at debt paydown first — the framework's specific worry at a dislocation — but the debt-first phase is largely complete: the $1B full-year reduction target was met in Q1 2026 and management said it could "rebalance that with share buybacks and shareholder distributions" [15].
Repurchase engine (P4b): not met — a hard-fail. The share count rose rather than fell, and the driver is stock-financed acquisitions: the all-stock Southwestern merger issued ~95.7M shares, dwarfing the ~5M cumulatively retired by buyback [16]. A rising share count from serial acquisition is disqualifying by the framework's own rule; this is the same mechanism that drops Accenture once adjusted. Counter-fact: the buybacks are executed, not just authorized (~$1.5B of real repurchases 2022-2025), and the count rise is a one-time step from an accretive merger, not a chronic SBC drip. Dividend cover (P4c) is not_applicable — the base dividend yields ~2.5%, too small to carry the return case. Detail on Self-Help.
Diagnosis (P5) — met, and it is favourable
The independent trial ruled the impairment more likely temporary than permanent: P(temporary) = 0.66 (mean 0.65, spread 0.07, per-judge 0.61-0.68), not contested, order-stable (temporary-first 0.68 vs permanent-first 0.635, gap 0.045). The near-term earnings hit behind the drawdown is close to zero — full-year 2026 guidance unchanged, Q1 2026 EPS beat by 5.4%, and FY2026 consensus above FY2025 actuals on revenue, EPS and FCF; the cut landed only in outer-year (FY2027) EPS, down ~17% from $10.07 to $8.36. Both sides of the trial are laid out on the Damage Math tab. Counter-fact and calibration: two exhibits from the temporary brief failed the judges' quote-check — an "estimates rose" claim contradicted by FY2027 EPS falling to $8.36, and a $2.21/MMBtu figure misattributed from a peer's benchmark — so the 0.66 rests on the surviving one-year FCF snapback and ~13% forward yield, and the permanent side's fixed midstream commitments held it below ~0.7.
Instrument context (I1) — not verifiable
The tally records I1 as not_verifiable: listed-option existence and current implied volatility could not be confirmed from a citable source inside the run corpus (the web-research pipeline failed on a billing error, and the Clock tab's option facts rest on public aggregators rather than a primary feed). This criterion never blocks the pillar verdicts; here it is moot, because the P1 gate already decides the fit.
What a 3x-in-3-years would require
The tally did not compute a re-rating price: "Re-rating math unavailable because the applicable bar or normalized adjusted FCF is missing" — the balance-sheet-scaled bar resolved to moderate but the framework-adjusted, normalized FCF is not_computable in the feature file (stock-based comp missing across FY2020-2025), so there is no adjusted-yield anchor to invert into a target price.
What can be said, as framework arithmetic rather than a target: at the 10% moderate-class bar, a 3x re-rating would need normalized adjusted FCF to hold near the mid-cycle $2.5B (acquisitions rolled off) and the multiple to expand toward the bar — i.e. consensus would have to concede a durable, through-cycle gas price around $3.50+/Mcf, which the Yield tab prices at roughly a 70-75% chance within 1-2 years. The base-rate context from the Clock tab is sobering for a "3x" ambition: in Expand's ~5.5-year post-bankruptcy history the deepest drawdown is only 33%, and comparable episodes round-tripped in 2 to 26 months — there is no precedent for the 60-70% forced-selling swing the framework's biggest wins came from. None of this is underwritten as a recommendation; the gate has already ruled the name out.
Contested and undetermined
Five criteria are recorded contested — X1, X2, X3, X4 and S1 — in every case because the two model families labelled a non-firing exclusion differently (not_met vs not_hit), not because they disagreed on the underlying facts. The name-masked seat returned not_met on all four gate exclusions, which is what raised the prior_driven_risk flag. Nothing was marked cannot-determine: every pillar reached a verdict, and the two features that could not be computed (adjusted-FCF yield, FCF stability) were rebuilt by hand from filed statements rather than left open.
Provenance
Source: fit tally provenance block and the adversarial trial tally.
Two families of models voted; they agreed on the verdict that matters — the year-10 gate failed on every seat, masked and unmasked, at a tight 0.06 spread — so the direction of the answer was pressed hard and did not move. Confidence is nonetheless low, and honestly so: the name-mask probe changed how the exclusions were labelled, which the framework treats as evidence that priors, not pure evidence, may be doing some of the work on those five contested criteria.
Falsifier ledger
These are the standing what-would-change-this conditions carried from the jury and the diagnosis trial's flip-conditions. They are redundant by design — harvested independently from multiple seats — and reproduced verbatim so each threshold, direction, and window stands on its own:
Data gaps
The run could not answer several things, and the verdict is stated with them in view: the deterministic feature file could not compute adjusted FCF, adjusted-FCF yield, FCF stability, balance-sheet class or revenue trajectory (stock-based comp and annual revenue absent from the XBRL feed, EBITDA missing for FY2025), so every adjusted figure was rebuilt by hand from filed 10-K cash-flow statements. There is no primary regulatory short-interest series (the feed returned zero rows), no Henry Hub price strip staged in the corpus, no independent year-10 gas-price forecast, and no confirmable listed-option/implied-volatility feed. The tradable history is only ~5.5 years post-Chapter-11 and the entity was reconstituted by the October 2024 Southwestern merger, so all base rates rest on a short, structurally shifting sample rather than a long franchise curve.
Business
Expand Energy is the largest independent U.S. natural gas producer, formed when Chesapeake Energy merged with Southwestern in October 2024 and took the new name. It pumps gas from three shale basins, sells at market-index prices, and carries a ~$22.0B market cap on Nasdaq — comfortably inside Ruchir's universe on both listing and size. It is a fragmented-market, price-taking commodity producer, not a consensus darling: the stock trades near 5x EV/EBITDA and has drawn down about 29% from its December 2025 high.
What the company sells, and to whom
Expand Energy is an independent exploration-and-production company: it drills for and sells natural gas, with small streams of oil and natural gas liquids (NGL) alongside. Following the Southwestern merger it is "the largest natural gas producer in the U.S., based on net daily production" [1]. All operations are onshore in the United States — Louisiana, Texas, Pennsylvania, West Virginia and Ohio — spread across three shale positions: the Haynesville and Bossier Shales, the Marcellus in Pennsylvania ("Northeast Appalachia"), and the Marcellus and Utica in Ohio and West Virginia ("Southwest Appalachia") [2].
The company holds a working interest in roughly 6,600 gross (4,600 net) wells, substantially all classified as productive gas wells, and operates about 99% of its daily production volumes [3]. Its customers are gas purchasers, pipelines and marketers; the economics are set by published price indices, not by the company. Gas and NGL are "sold to purchasers under index contracts or daily spot price contracts," and oil at a differential to NYMEX WTI [4]. One purchaser accounted for 11% of total revenue in 2025; no other reached 10% [5]. In two sentences: Expand Energy digs natural gas out of three U.S. shale basins and sells it at market-index prices to pipelines and marketers. It is the biggest such producer in the country, but a price-taker in a commodity it does not control.
Segments and geography — where the revenue is
The business reports a single operating segment; its revenue splits by commodity and by basin rather than by division. In FY2025 natural gas supplied $7,433M of the $8,476M of combined oil-gas-NGL revenue, with NGL $724M and oil $319M — this is a gas company with trace liquids, not a diversified energy producer. A further $3,163M of marketing revenue (reselling third-party and own volumes) and $550M of derivative gains lift total revenue to roughly $12.1B.
Sources: natural gas, oil and NGL sales from the FY2025 Annual Report results-of-operations table [6]; marketing and derivative revenue from the Consolidated Statements of Operations [7].
Geographically the three basins are close to balanced, which matters for durability: no single field carries the company. Haynesville produced $3,477M of field revenue in FY2025, Northeast Appalachia $2,860M, and Southwest Appalachia $2,139M.
Source: FY2025 Annual Report (Form 10-K), natural gas, oil and NGL sales by operating area [8].
Scale
FY2025 was the first full year of the merged company. It produced 2,622 billion cubic feet of gas equivalent (Bcfe) — about 7.2 Bcfe per day, of which 2,409 Bcf was gas [9] — on roughly 1,600 employees [10], and earned $1.82B of net income on the ~$12.1B of revenue [11].
Market Cap ($M)
FY2025 Revenue ($M)
FY2025 Net Income ($M)
Production (Bcfe)
Employees
Net Debt ($M)
Sources: market cap derived from fit_features (240.37M shares at the $91.52 close of 2026-07-24); revenue and net income from the Consolidated Statements of Operations [12]; total production per the production table [13]; employees per Human Capital [14].
Since the merger the company has reduced total debt by roughly $1.2 billion, upsized its credit facility to $3.5 billion, joined the S&P 500, and returned about $865 million to shareholders in 2025 through dividends and buybacks — all on an investment-grade balance sheet [15]. Net debt at year-end was $4.4B against $5.0B of total debt and $0.6B of cash [16] — moderate leverage that the Self-Help and Yield tabs carry forward.
Market structure — the P1 raw material
Ruchir's durability gate leans first on market structure, and here the evidence points to a fragmented, price-taking commodity industry, not a monopoly or protected oligopoly.
Fragmented, and the "largest" holds a mid-single-digit share. Expand is the biggest U.S. gas producer, but "biggest" in this industry is small. Its ~6.6 Bcf/d of net gas output is roughly 6% of the ~106 Bcf/d the United States produced in 2025 (per EIA data). Its closest peer, EQT, is a similar ~6% of national output. Dozens of independents and the majors make up the rest. The 10-K describes the competitive field plainly: "We compete with both major integrated and other independent natural gas and oil companies, as well as pipeline marketing affiliates and other marketing companies," and adds that "some of our competitors may have larger financial and other resources than us" [17].
The corpus supports the named peer set: EQT (the other Appalachian scale leader), Antero, Range Resources, Coterra, Comstock and Gulfport all compete in Expand's basins. On market cap Expand sits at the top of the U.S. gas-pure-play group, but it is one player among many rather than a dominant one.
Source: market caps derived from each company's latest shares outstanding and the 2026-07-24 close in the peer price feeds; peer set per the FY2025 Annual Report competition disclosure [18].
No pricing power; the product is essential but the seller is not. The company takes the published index price — under index contracts "the price we receive is tied to published indices" [19]. The 10-K's own risk language stresses that price volatility "make[s] it extremely difficult to predict future natural gas, oil and NGL price movements" [20]. Natural gas itself is essential — it fuels power generation, heating and industry, with LNG export demand rising — so the commodity is durable even if any one producer's price is not.
Capital intensity as the real barrier. The entry barrier here is capital, not regulation or brand. Expand carries $24.4B of net property, plant and equipment against $28.3B of total assets [21] — an asset-heavy business where reserves deplete and must be continuously replaced with drilling capital. That capital intensity is the moat Ruchir looks for in "capital-heavy essentials," and it is genuine. What is not present is a regulatory entry barrier of the bank-or-insurer kind: there is no license the regulator withholds from a new shale entrant. Regulation raises the cost of operating, but it does not ration who may compete.
Operating history — long corporate life, short current identity. Chesapeake Energy dates to 1989, which reads as the "30–50 year" history Ruchir favors. The important qualifier: Chesapeake filed for Chapter 11 and "emerged from bankruptcy on February 9, 2021," at which point "all existing equity was canceled and New Common Stock was issued" to former creditors [22]. The Expand name and the current asset base only date to the October 2024 merger [23]. So the equity in front of Ruchir has a ~5-year track record under its current capital structure and under two years under its current identity — a fact the Durability tab weighs against the "long operating history" durability signal, not something to wave through on the 1989 founding date alone.
Universe screen — U1, U2
Both universe tests pass, cleanly.
U1 — listing and instrument. Expand Energy trades as U.S. common stock on the Nasdaq under EXE (CIK 0000895126); it is a U.S.-incorporated (Oklahoma) domestic operating company, not an ADR and not a Chinese issuer. Inside the universe.
U2 — market cap above the $10B line. At the $91.52 close on 2026-07-24, the ~240.37M shares outstanding put the market cap at roughly $22.0B — more than double the $10B threshold.
Universe screen: U.S.-listed common stock (Nasdaq: EXE), market cap ~$22.0B against the $10B floor. Both universe tests pass.
Source: market cap derived from fit_features (240.37M shares at $91.52, 2026-07-24).
Exclusion screen — X1, X4, S1
Of the checks this tab can settle from the corpus, none trip.
X1 — auto-OEM: not applicable. Expand is a natural gas producer, not a car maker or auto-parts supplier. This is not the undifferentiated, excess-capacity car business Ruchir excludes.
X4 — consensus-saturated darling: does not trigger. The darling exclusion is for high-growth names on extreme multiple-to-sales with a bottom-left-to-top-right chart, where the whole consensus already owns the story. Expand is the opposite profile on every axis. It trades at roughly 1.8x sales ($22.0B market cap on $12.1B revenue) and near 5x EV/EBITDA (per current market data) — a low-multiple cyclical, not a growth premium. Its chart shape is a drawdown, not a melt-up: the stock drew down about 29% from its December 2025 peak (the Dislocation tab anatomizes the fall). And coverage tone is cautiously constructive rather than euphoric — the analyst consensus is a "Buy" with a 12-month target near $124, some 35% above the current price, which is the sell side seeing a discount, not a crowd that has already piled into a story. X4 does not apply.
Price / Sales (x)
Peak-to-Trough Drawdown
Consensus Target vs Price
Sources: P/S derived from fit_features market cap and FY2025 revenue [24]; drawdown from fit_features capitulation gauge; consensus target per current market data.
S1 — China dependence: absent. All of Expand's operations are onshore in the United States [25], and gas is sold to U.S.-index and spot purchasers [26]. China appears in the 10-K only as generic geopolitical risk — "changes in China-Taiwan relations" affecting global energy markets [27] — not as a revenue or asset dependence. There is no material China exposure to flag. (Rising LNG export demand is a future channel to international buyers, but Expand's booked revenue is domestic-index gas.)
The promotional-CEO (X2) and structural-decline (X3) checks belong to the Self-Help and Durability tabs; nothing in the business description forces either here. The one item this tab hands forward is the operating-history nuance above: a 1989 corporate age, but a 2021 equity reset and a 2024 identity — evidence the durability gate should weigh directly.
Expand Energy fell 29.2% from a $122.89 close on 3 December 2025 to $86.95 on 20 July 2026 — a 229-day grind, not an event crash. The one dated adverse event, the 9 February 2026 CEO exit and Houston-move announcement, cost 6.5% in a single session; the rest tracks a soft natural-gas tape. Traded volume peaked at only 1.43× its pre-fall median — orderly repricing, not capitulation. Estimates eased far less than the price.
The drawdown, quantified
Peak close — 3 Dec 2025
Trough close — 20 Jul 2026
Current close — 24 Jul 2026
Source: daily price history, as reported (Nasdaq: EXE); drawdown per fit_features.capitulation_gauge.drawdown.
The fall measures −29.2% peak-to-trough over 229 days, and the stock sits −25.5% below its December peak at the current $91.52. This is a shallow, slow decline, not the 60–70% forced-selling collapse the framework hunts for. It came in no distinct legs: from the December peak the price ground lower month after month, with the only visible step-down clustered around the February management change. The single sharpest sessions were −6.5% on 9 February 2026 and −4.5% on 23 February — modest against the 29% cumulative move.
Source: daily price history, as reported (Nasdaq: EXE); month-end close.
The trigger
The one identifiable, dated adverse event is a governance and strategy shock, not an earnings cut. On 9 February 2026 the company announced that CEO Nick Dell'Osso would step down, that Chairman Michael Wichterich would take over as interim CEO, and that the headquarters would move to Houston from Oklahoma City in mid-2026 [1]. The stock closed −6.5% that day on 6.7 million shares, 2.16× the pre-fall median (detail below). On the Q4 call two weeks later, management framed the shake-up as "the change that we made last week … a reflection of the changing natural gas business," a change in "tactics and focus" rather than strategy [2].
That event leg has to be separated from the drift around it. The December-to-February slide of roughly 12% ran on ordinary volume with no company-specific event — the framework's own test treats a fall of that kind as drift, not a moment of fear. The dominant force through the whole window is the commodity: management flagged that "we are seeing volatility in gas prices today. You have seen it all quarter," and credited a hedging program with $200 million of gains for cushioning it [3]. A pure-gas producer's equity re-rating with the strip is a price-of-gas story, not a broken-business story.
The results that punctuated the fall did not confirm a deterioration. FY2025 came in at $7.67 EPS with a 2026 outlook of roughly 7.5 Bcfe/d and at least $1 billion of further debt reduction on 17 February [4]; Q1 2026 then beat, with net income of $1.16 billion, $1.3 billion of debt reduction and $150 million of buybacks, and full-year guidance reaffirmed on 28 April [5]. The price kept sliding after both — the tell that this is a macro/commodity re-rating overlaid on a leadership change, not a reaction to results.
The fear gauge
Volume never spiked to capitulation levels during the fall. The measured gauge is 1.43× — the maximum 20-day average volume inside the peak-to-trough leg divided by the median daily volume over the 180 days before the peak (≈3.1 million shares) — and that 20-day peak fell in late March, not at the July low.
Source: daily volume history, as reported (Nasdaq: EXE); multiple vs fit_features.capitulation_gauge 180-day pre-peak median.
Individual sessions did tick up — 2.16× on the 9 February CEO-exit day and 2.66× on 18 February as the Q4 print was digested — but no 20-day window in the entire decline averaged more than 1.43× normal. The genuinely heavy-volume days in this stock's record sit before the December peak: 11.98× on 21 March 2025 and 6.42× in June 2022. Emotion-driven, exhaust-the-sellers volume is what the framework's entry condition requires, and the tape here does not show it. This was orderly distribution, not panic.
Who was selling
There is no evidence of forced or structural selling. Reported short interest is low — roughly 2.4% to 2.8% of shares outstanding as of July 2026 (per public aggregators; the run's regulatory short-interest feed returned no rows) — so no crowded short was covering or capitulating into the fall. No index-exit, fund-liquidation, or disclosed insider-selling event is visible in the corpus. If anything the holder base was widening on the way in: EXE joined the S&P 500 in the March 2025 rebalance and completed investment-grade ratings across all three agencies [6], an index-inclusion inflow rather than a forced exit. The selling that produced this drawdown reads as generalist and index holders trimming a gas name as the strip softened — informed repricing, not anchored liquidation.
Estimates vs price timing
The framework's signature is a price fall that outruns the estimate cut. That direction holds here, but softly — because there was no acute cut to outrun. Over the drawdown window the sell side moved its forward numbers only modestly, and its cash-flow view barely at all.
Source: consensus revision snapshots 27 Jan → 26 Jul 2026, data/sp/estimates.json (momentum series); price per fit_features.capitulation_gauge.
Consensus FY2027 revenue actually rose about 3% over the six months (FY2028 revenue about 8%), while FY2027 normalized EPS eased roughly 17% (from $10.07 to $8.36) and FY2028 EPS about 6% — a margin/gas-price adjustment, not a demand cut. Forward free-cash-flow estimates stayed robust: consensus FCF implies a 13.1% yield on the current market cap for FY2026 and 11.9% for FY2027 on the run's feature file. And the company kept beating — Q1 2026 normalized EPS printed $3.83 against a $3.63 consensus, a 5.4% surprise. So the price fell 29% while revenue estimates rose, EPS estimates fell about 17%, and the FCF outlook held. The price outran the fundamentals, but the fundamentals were nudged, not slashed — this is not the whole-industry, one-year guidance-cut anchor the framework prizes.
Bottom line
What happened to EXE is a shallow, orderly, commodity-led derating with a governance shock in the middle of it — drift-dominated, not a capitulation. The 29.2% fall is well short of forced-selling depth; the one dated trigger (the 9 February CEO exit and Houston move) explains a single 6.5% session, not the move; and the fear gauge tops out at 1.43× normal volume, so the emotion-driven capitulation P3 requires is absent. The one element that points the framework's way is the estimates-versus-price divergence — the price re-rated further than the numbers did — but with forward FCF holding and no acute earnings cut to anchor to, this is a soft version of the signature, not the clean dislocation the entry condition describes. Whether the gas-price and margin softening behind it is temporary or permanent is the question for Damage Math and the trial, not this tab.
Damage Math
Expand Energy's equity lost about $7.5 billion of market value from its December 2025 peak — roughly a quarter — while the company's own 2026 guidance held and Q1 2026 beat. The cut landed in outer-year consensus: FY2027 EPS fell about 17% over six months. A two-scenario cash-flow model puts fair value between $20 billion (permanent) and $34 billion (temporary); at $22 billion the tape prices ~28% odds on the temporary reading, against the trial's 0.66.
The near-term hit
The near-term operating hit is unusually small for a 25% drawdown. Management left full-year 2026 production and capital guidance unchanged through the decline [1], and the first print of the year beat: Q1 2026 normalized EPS came in at $3.83 against a $3.63 consensus (+5.4%), on revenue of $3,315M versus $3,054M expected (+8.5%). Consensus for the full year FY2026 sits above FY2025 actuals — revenue $9,945M versus $8,476M, normalized EPS $8.44 versus $6.10, free cash flow $2,878M versus $1,839M.
Where estimates fell is the outer years. Normalized FY2027 EPS was marked from $10.07 six months ago to $8.36 now — about a 17% cut, most of it in the last month ($9.50 on 26 June to $8.36 on 26 July). FY2028 slipped more mildly, $10.06 to $9.44.
Source: consensus estimates, normalized EPS revision history, as reported.
The signature is inverted: the price fell while the near-term numbers rose and the company reaffirmed. That is the fingerprint of multiple compression tied to the gas strip and outer-year discounting, not a cut to next year's earning power. The Dislocation tab anatomizes the tape; here the point is narrower — the numerator of any damage calculation, the actual near-term earnings hit, is close to zero.
Price against value
Source: derived from the daily price series (peak close $122.89 on 3 Dec 2025; $91.52 on 24 Jul 2026) and net debt of $4,393M (fit_features:balance_sheet_class); company filings, as reported.
At 240.37M shares, the peak close of $122.89 valued the equity at $29.5 billion; the 24 July close of $91.52 values it at $22.0 billion — a $7.5 billion, 25.5% fall, deepening to 29.2% at the 20 July trough. Adding net debt of $4,393M, enterprise value moved from $33.9 billion to $26.4 billion, the same $7.5 billion in absolute terms (22.2% of the peak EV). So the denominator of the damage question — the value the market erased — is about $7.5 billion.
The NPV arithmetic
The question is how much of the NPV of future cash flows a small, outer-year earnings mark plausibly destroys. Two scenarios, one discount rate, workings shown.
Assumptions. Discount rate 10% — a reasonable cost of equity for a levered gas producer, and the same reference the Yield tab uses. Free cash flow here is the reported measure (operating cash flow minus capex), which is struck after cash interest and therefore accrues to equity; discounting it at the cost of equity yields an equity value directly, with no separate net-debt subtraction. Sustainable free cash flow is capitalized as a perpetuity, shown at zero growth (conservative floor) and 2% growth.
- Temporary (cyclical). Sustainable FCF equals the FY2026–FY2029 consensus average of $2,715M. At 10% and zero growth, equity value is $2,715M ÷ 0.10 = $27.2B; at 2% growth, $2,715M × 1.02 ÷ 0.08 = $34.6B.
- Permanent (level shift). A durable step-down in realized gas price against fixed midstream cost compresses sustainable FCF to roughly $2,000M — the FY2025 delivered level ($1,839M reported / $1,990M consensus). At zero growth, $2,000M ÷ 0.10 = $20.0B; at 2% growth, $25.5B.
Source: derived from consensus free-cash-flow estimates (FY2026–FY2029 mean $2,715M) and FY2025 reported FCF of $1,839M; company filings and consensus estimates, as reported. Cross-reference Yield.
The current market cap of $22.0 billion falls inside the permanent range ($20.0B–$25.5B) and below the temporary range ($27.2B–$34.6B). Put the same arithmetic the other way, a 10% zero-growth perpetuity that reproduces the $22.0 billion tape implies sustainable FCF of $2,200M — 28% of the way from the impaired $2,000M to the mid-cycle $2,715M. The market is pricing roughly a 28% weight on the cyclical recovery.
The damage gap
Weighting the two scenarios by the trial's 0.66 probability that the hit is temporary:
- At zero growth: 0.66 × $27.2B + 0.34 × $20.0B = $24.7B fair value, a $2.7B (12%) gap above the $22.0B tape.
- At 2% growth: 0.66 × $34.6B + 0.34 × $25.5B = $31.5B, a $9.5B (43%) gap.
- Scenario midpoints give $28.1B, a $6.1B (28%) gap.
The price fell about $7.5B (25.5% from peak). A probability-weighted fair value using the trial's 0.66 temporary reading sits at roughly $24.7B–$31.5B, leaving a gap of about $2.7B–$9.5B — the value the tape appears to have destroyed beyond the plausible NPV damage. That gap exists only because the trial rules the hit more likely temporary (0.66) than the tape prices it (~0.28). On a pure permanent reading, fair value of $20.0B–$25.5B brackets the $22.0B market cap, and the gap is absent — the price fell about as much as the value.
Source: derived from the two-scenario model above and ruchir/trial/tally.json (p_temporary 0.66).
Two conservatism checks on the gap. First, the base model treats reserve replacement as the maintenance requirement (it is inside the $2.75–$2.95 billion capex, which is already deducted from FCF) and treats acquisitions as discretionary growth; netting the serial-acquirer cash cadence of about $560M a year (see Yield) would cut roughly $5.6B from each scenario and erase the gap under permanence. Second, the model uses reported FCF, not the SBC-and-acquisition-adjusted figure the framework prefers, which the Yield tab shows the vendor feed cannot compute directly. Both pull toward the smaller, permanent-leaning end of the range.
The trial
The temporary-versus-permanent question was argued by two opposing, corpus-cited briefs and ruled on by three independent judges. Both cases, at their strongest:
The bull rebuttal to permanence — synergies are real (2025 debt down about $1.2 billion, $865 million returned to shareholders [14]) — does not itself settle whether trough cash flow is durably impaired. The permanent rebuttal — the Delfin LNG offtake that anchors long-run demand is "subject to final investment decision" with a targeted 2031 start [15] — concedes the demand option is delayed and contingent.
The ruling. The judges put the probability the impairment is temporary at 0.66 (mean 0.65, spread 0.07 across a 0.61–0.68 range); the result is not contested, and it was stable to reading order (temporary-first mean 0.68 versus permanent-first 0.635, a 0.045 gap). This diagnosis probability is the report's; the analysis on this tab adds context but does not override it. Two of the temporary brief's exhibits did not survive the judges' quote-check and were discounted: the claim that estimates "rose" (FY2027 EPS in fact fell to $8.36) and a $2.21/MMBtu figure attributed to Expand's realized gas price that is in fact a peer's 12-month trailing benchmark. The surviving temporary evidence — the one-year FCF snapback and the ~13% forward yield — is what carries the 0.66.
Source: ruchir/trial/tally.json — per-judge probabilities, spread 0.07, order-stability gap 0.045.
Which line broke
The driver behind the hit is the realized natural-gas price; the driver behind the permanence question is unit midstream cost. Consensus driver estimates separate the two.
The price line mean-reverts and consensus already assumes it has: forward natural-gas realizations sit near $3.31/Mcf in FY2026 and $3.25 in FY2027 (Henry Hub around $3.70 and $3.55), recovered from the FY2024 trough that took FCF to $8M. That is the self-correcting piece — same reserves, higher price, restored cash flow.
The cost line does not revert on the same terms. Gathering-and-transportation expense reached $0.91/Mcfe in 2025 from $0.75 in 2024 [16], against $9,572M of fixed, largely off-balance-sheet transport commitments [17], and consensus holds unit GP and T near $1.02/Mcfe in FY2026 easing only to $0.99 in FY2027 — not back toward the 2024 $0.75. Whether the hit self-corrects depends on whether the price line recovers faster than the cost line stays fixed. The trial's flip conditions name exactly this: gas sustaining below ~$2.50/MMBtu through 2027, GP and T staying near $0.91 while realizations weaken, or the 2026 standardized measure falling materially below the 2025 $17,126M on price-driven reserve revisions.
Source: consensus driver estimates (Visible Alpha), realized natural-gas price per Mcf and gathering/transportation per Mcfe; unit GP and T also per the FY2025 10-K [18].
Yield
Expand Energy's real (adjusted) free-cash-flow yield computes to 5.6% on FY2025: reported FCF of $1,839M, less $46M of stock compensation and a $563M five-year-average acquisition charge, over a $22.0B market cap — about 440 bps under the 10% bar its balance sheet selects. But FY2025 is a recovery year off a historic 2024 gas-price trough. Consensus forward FCF yields 11.5%–13.1% for 2026–2029, and mid-cycle adjusted yield normalizes to roughly 9.6%–11.2%, straddling the bar.
A note the reader should carry through this tab: the deterministic feature file could not compute adjusted FCF, its yield, or the balance-sheet class, because the structured cash-flow feed carries no stock-based-compensation line and treats acquisitions as zero. Every adjusted figure below is rebuilt by hand from the filed 10-K cash-flow statements, with the arithmetic shown.
The adjustment, line by line
Adjusted FCF strips two things from reported free cash flow: the non-cash stock compensation that dilutes owners, and a five-year average of cash spent on acquisitions — the framework's way of charging a serial acquirer for the deals that build its cash flow. For Expand Energy the second item is the large one. Since emerging from bankruptcy in February 2021 the company has bought Vine (2021), Chief/Marcellus (2022) and, in an all-stock deal, Southwestern (2024); cash acquisition outlays over FY2021–FY2025 averaged $563M a year.
Reported FCF and SBC: FY2025 10-K Consolidated Statements of Cash Flows [1] and FY2023 10-K [2]. Cash acquisitions = "Business combination, net" plus "Property acquisitions" [3][4]. Adjusted FCF = reported FCF − SBC − same-year cash acquisitions; feature fit_features.adjusted_fcf not_computable (no SBC field).
The final column uses each year's own acquisition spend to show the raw shape. The framework's canonical version instead applies the five-year average acquisition charge. On that basis:
FY2025 adjusted FCF = $1,839M reported − $46M SBC − $563M (5-yr avg acquisitions) = $1,230M.
That $609M gap between reported ($1,839M) and adjusted ($1,230M) FCF is almost entirely the acquisition normalization, not stock comp — SBC here is trivial, $46M against a $22B company. Where a software name fails this test on dilution, Expand Energy's adjustment is a deal-spend charge.
The yield, three ways
Reported FCF Yield (FY25)
Adjusted FCF Yield (FY25)
Trailing 3-yr Avg Adjusted
Yields on $22.0B market cap ($91.52 × 240.37M shares, 24 Jul 2026). Reported = $1,839M/$22.0B; adjusted (framework) = $1,230M/$22.0B; trailing 3-yr = FY2023–25 average of ($197M) framework-adjusted FCF. Derived from FY2025 10-K cash-flow statement [5]; market cap per fit_features.market_cap.
- Current adjusted yield: 5.6% ($1,230M / $22.0B). The reported 8.4% overstates it by ~280 bps once the acquisition charge is applied.
- Trailing 3-year average adjusted yield: ~0.9%. Applying the $563M average acquisition charge to each year gives adjusted FCF of −$45M (FY2023), −$593M (FY2024) and $1,230M (FY2025) — an average of about $197M. This number is not representative and should not be read as the run-rate: FY2024 was a historic gas-price trough (reported FCF just $8M) and the company roughly doubled in size mid-window via the October 2024 all-stock Southwestern merger, so the FY2023–24 figures belong to a materially smaller company. For a cyclical that just merged, the trailing average is the wrong lens; the mid-cycle normalization below is the right one.
- Own yield baseline distribution: not meaningful. The feature
fit_features.yield_baselineis not_computable, and rebuilding it by hand would compare yields across two different companies — Chesapeake emerged from Chapter 11 in February 2021 on fresh-start accounting, and the share count went from ~157M (FY2024) to 240M (FY2025) on the Southwestern stock issuance [6]. The "stable-baseline-that-suddenly-jumps" fortress signature the framework looks for cannot be tested here; there is no stable pre-history at the current scale.
Which bar applies
The bar is selected by the balance sheet. Net debt is long-term debt of $5,009M, no current maturities, less cash of $616M — $4,393M [7]. Against FY2025 EBITDA — operating income $2,471M plus D&A $2,980M = $5,451M, or about $4.9B excluding the $550M non-cash derivative gain [8] — net debt/EBITDA is 0.8x–0.9x.
Net Debt ($M)
EBITDA, FY25 ($M)
Net Debt / EBITDA
Net debt from FY2025 balance sheet [9]; EBITDA = operating income + D&A from the FY2025 statement of operations [10]. Feature fit_features.balance_sheet_class not_computable (EBITDA field absent).
At 0.8x–0.9x the framework's rule (fortress at or below 0.5x, levered at or above 3.0x, else moderate) places Expand Energy in the moderate class, so the 10% bar applies — not the 25% levered bar. The company is investment-grade rated (BBB− at S&P and Fitch, Baa3 at Moody's) and joined the S&P 500 in March 2025 [11]; it sits closer to the fortress line than most E&Ps. What keeps it out of the fortress class is the cyclicality of the denominator: at the FY2024 trough, EBITDA of roughly $0.9B would have put leverage near 5x. Judged on mid-cycle EBITDA it is comfortably under 1x, but calling it fortress would understate the swing.
Position against the bar, in plain arithmetic:
- Current adjusted FCF yield 5.6% on FY2025 against the 10% bar — 440 bps short.
- Reported (unadjusted) FCF yield 8.4% against 10% — 160 bps short.
Normalized mid-cycle yield
Expand Energy is a commodity producer, so FCF tracks the Henry Hub gas price, and FY2025 is neither peak nor trough. The reported record makes the cyclicality explicit — FCF ran $2,302M in the 2022 price spike, collapsed to $8M in the 2024 trough, and recovered to $1,839M in 2025 [12]. A single year, up or down, is the wrong basis for the yield.
Because the combined ExpandEnergy (post-Southwestern, roughly 7 Bcf/d) has only one full reporting year, history cannot supply a clean mid-cycle base at current scale. The defensible anchor is consensus forward FCF, which is the sell side's own mid-cycle view: FY2026–FY2029 FCF averages $2,715M (fit_features.consensus_forward_yield, from CapIQ estimates dated 27 Jul 2026). The assumptions embedded in it are a mid-cycle Henry Hub around $3.50–$4.00, capex near $2.9B a year, and no major asset additions.
Applying the framework adjustments to that base, with the acquisition charge as the swing variable:
Mid-cycle FCF = consensus FY2026–29 average $2,715M, less $50M SBC (FY2025 run-rate), less the stated acquisition charge. Derived from CapIQ consensus (fit_features.consensus_forward_yield) and the FY2025 SBC line [13].
So mid-cycle adjusted yield is 9.6% if the trailing $563M acquisition pace continues, 11.2% if deal spend rolls off toward a bolt-on level near $200M — straddling the 10% bar, midpoint about 10.4%. A skeptic can recompute under a lower gas deck: hold acquisitions at $200M but cut mid-cycle FCF to the FY2027 consensus low of $2,611M and the yield still clears the bar at ~11.6%; take the whole base down to a $2,100M gas-price stress and it falls to ~9.3% even with acquisitions rolled off. The decisive assumption is not the gas deck within the consensus range — it is whether Expand Energy is finished as a serial acquirer.
Management's stated 2026 priority is debt reduction and shareholder returns, not further consolidation [14]. If that holds, the acquisition charge decays and mid-cycle yield sits near 11%. If large debt- or stock-funded M&A resumes, the charge reasserts and the yield sits below the bar.
The consensus check and the reversion path
Unusually for this framework, direct FCF consensus exists and clears the bar with room to spare. On today's $22.0B market cap:
Consensus FCF (mean) and implied yield on $22.0B market cap, per fit_features.consensus_forward_yield (CapIQ estimates, 27 Jul 2026). The 10% bar sits between the FY2025 and FY2026 bars.
Consensus forward FCF yields 13.1% (2026), 11.9% (2027), 12.9% (2028) and 11.5% (2029) — the sell side already carries an unadjusted FCF yield above the 10% bar for four straight years, on 22–23 EBITDA estimators. After the framework's adjustments (SBC plus a normalized acquisition charge of $200M–$563M), the forward figure comes down to roughly 9.6%–12%, still at or above the bar in most of that range.
Because the current adjusted yield (5.6%) sits below the bar, the reversion has to be underwritten rather than assumed. The path back above 10% within one to two years rests on three mechanisms, all already in consensus:
- Gas-price normalization off the 2024 trough. FY2026 consensus revenue is up ~17% and EBITDA up ~17% versus FY2025 as Henry Hub recovers from the sub-$2.50 2024 average.
- Full-year merged scale plus synergies. FY2025 was the first full year of the combined company; the Southwestern integration adds volume and targeted cost synergies that consensus builds into the 2026–2028 step-up.
- Acquisition spend rolling off as the consolidation phase ends and capital shifts to debt paydown and returns [15], which shrinks the framework charge that pulls the adjusted yield below the reported one.
My estimate: roughly a 70–75% probability that framework-adjusted mid-cycle yield holds at or above the 10% bar within one to two years, conditional on Henry Hub averaging about $3.50 or better and no return to transformational deal-making. What consensus would have to concede for it to fail is a sustained sub-$3 gas environment on the scale of 2024, or a resumption of debt-funded acquisitions — either would keep adjusted yield in the 5%–9% band. The setup reads more as gas-price and merger-timing fear than a fundamental yield shortfall, with one honest caveat that belongs to the Dislocation tab: the drawdown's volume gauge (~1.4x) is muted, so this looks less like peak capitulation than a slow re-rating.
FCF-to-revenue conversion
Conversion is cyclical, not deteriorating. Free cash flow as a share of upstream (gas/oil/NGL) revenue ran 26% (FY2021), 23% (FY2022), 16% (FY2023), 0.3% (FY2024) and 22% (FY2025).
FCF from cash-flow statements [16]; upstream revenue ("Natural gas, oil and NGL") from the FY2025 [17] and FY2023 [18] 10-Ks.
Away from the 2024 trough, conversion clusters in the low-to-mid 20s of upstream revenue — normal for a low-cost gas producer and a mid-cycle level the consensus deck implies going forward. The single 0.3% reading is the price trough, not a break in the model; the framework treats an occasional lean year every several years in a commodity business as expected rather than disqualifying. There is no three-year slide in conversion to undercut the durability case. The limitation to state plainly: with only about five years of post-bankruptcy history at ever-changing scale, the framework's rolling-five-year stability test (fit_features.fcf_stability not_computable) has a thin base here — the read on conversion is a cyclical-range judgment, not a long stable series.
Durability
The year-10 gate asks whether revenue and adjusted free cash flow will both be higher a decade out, with very high conviction. Expand Energy is the largest independent U.S. gas producer, on 25,880 Bcfe of reserves and a $19.4B PV-10 [1] [2], but a commodity price-taker whose free cash flow ran from $8M to $2.3B in six years and whose predecessor went bankrupt in 2020 [3]. Year-10 cash flow rests on an unforecastable Henry Hub price: the gate does not hold.
What Expand is, in one paragraph
Following the October 2024 merger with Southwestern Energy, Chesapeake Energy renamed itself Expand Energy and became the largest independent natural gas producer in the U.S. by net daily production, with interests in roughly 6,600 gross wells across the Haynesville and the Marcellus and Utica shales; it was added to the S&P 500 in 2025 and carries an investment-grade balance sheet [4]. Full company detail sits in the Business tab; this tab tests the franchise against the durability gate, and builds market-structure findings on it rather than repeating them.
The conviction sources, one by one
His conviction that a business survives ten years comes from five specific places: market structure, regulatory entry barriers, capital intensity, essentialness, and a long operating history through cycles. Graded honestly for a natural gas E&P, two apply in part, one applies to the product but not the company, and two do not apply at all.
Source: graded from FY2025 Form 10-K, Item 1 Business, Item 2 Properties, and the FY2023 Form 10-K bankruptcy disclosures [5] [6] [7].
Market structure — does not apply. Being the largest independent gas producer is a scale and cost distinction, not a pricing one. Expand produced 2,622 Bcfe in 2025 [8], roughly 7 Bcfe per day against U.S. dry-gas output above 100 Bcf/d — single-digit national share. The price it receives is set at Henry Hub by thousands of producers and cannot be controlled: the 10-K states plainly that results "depend primarily upon the prices we receive for the natural gas, oil and NGL we sell" [9]. The genuine adjacency — EQT, Coterra, Range Resources, Antero, Comstock — is a set of large independents, none dominant. This is oligopoly in size, not in power.
Regulatory entry barriers — do not apply. The regime is extensive — permits to drill, conservation and spacing rules, methane and emissions regulation — but it raises the cost of operating for everyone and protects no incumbent's market share [10]. This is the opposite of the bank or insurer case, where the regulator itself is the moat.
Capital intensity — applies in part. This is the strongest conviction source for Expand. Proved reserves stood at 25,880 Bcfe at year-end 2025, with a PV-10 of $19,374M and a standardized measure of $17,126M [11]. Replacement cost is real, and a garage startup cannot assemble this acreage. Two qualifiers keep it from being a clean moat: the reserve life is only about ten years (25,880 Bcfe of proved reserves against 2,622 Bcfe of 2025 production), so sustaining output beyond a decade requires continuous reinvestment against shale's steep decline curves; and the $19.4B PV-10 is itself a function of the gas price — it was struck on a $3.39/Mcf deck, versus the $2.13/Mcf deck used a year earlier [12]. The asset base is large, but it is a depleting bet on price, not a toll road.
Essential product — applies to the product, not the franchise. Natural gas is genuinely essential and demand is durable and growing; that protects the commodity, not Expand specifically. A power plant or LNG terminal will still burn gas in 2035, but it can source it from any of dozens of producers. There is no captive customer and no switching cost — the concentration disclosure notes a single purchaser at 11% of revenue in 2025, and different purchasers in prior years [13].
Long history through cycles — does not apply. This is the decisive strike. Chesapeake filed voluntary Chapter 11 petitions on June 28, 2020, and emerged on February 9, 2021, at which point "all existing equity was canceled" and new stock issued to creditors [14]. The company did not survive the last downcycle; it went through it in bankruptcy and wiped out its owners. Fresh-start accounting makes the current entity under five years old for reporting purposes, and the Expand name is under two. The framework prizes 30-to-50-year survivors precisely because they have proven they weather cycles. Expand's record proves the opposite.
The structural threats, hunted
Source: FY2025 Form 10-K risk factors and MD and A; six-year cash-flow record from the FY2023 and FY2025 Forms 10-K [15] [16].
The core threat is not substitution or regulation — it is the commodity price itself, and it is not quantifiable at a ten-year horizon. The company's own free cash flow demonstrates the range: $22M, $1,140M, $2,302M, $551M, $8M, $1,839M across FY2020 through FY2025 [17] [18]. The reserve price deck moved 37% in a single year — $3.39/Mcf for 2025 versus $2.13/Mcf for 2024 [19].
Source: Consolidated Statements of Cash Flows, operating cash flow less capital expenditures, FY2023 and FY2025 Forms 10-K [20] [21].
On substitution, the 10-K is candid: the company faces "indirect competition from alternative energy sources, including wind, solar and electric power," and warns that "conservation measures and technological advances could reduce demand for natural gas and oil" [22] [23]. This cuts both ways at year ten. Renewables and efficiency cap the demand upside in power generation, but management points to "structural demand gains from LNG, power generation, and industrials" tightening the market through 2027, and it is building toward the LNG value chain — the NG3 gathering pipeline came into service in October 2025, and it hired a former ExxonMobil global-LNG executive [24] [25]. The demand outlook is plausibly a tailwind for volume. It resolves none of the price uncertainty.
The disqualifier check — three years of high-single-digit revenue decline
The deterministic feature fit_features.revenue_trajectory is not_computable here: the XBRL feed
carried no revenue line, so per_year is empty and three_year_hsd_decline reads false by
default rather than by measurement. Computed by hand from the filed statements of operations, the
flag genuinely does not fire — but the shape of the history is the point.
Source: Consolidated Statements of Operations, natural gas, oil and NGL revenue line; FY2021 is the sum of the Successor and Predecessor periods. FY2023 and FY2025 Forms 10-K [26] [27].
Commodity revenue fell in 2023 and again in 2024 — two consecutive declines, on a 64% collapse in
2023 alone — then rebounded to $8,476M in 2025 on recovering prices and the merger's added volume
[28] [29]. The disqualifier is written for a business bleeding out slowly; Expand's revenue does not
decline for three straight years because it is cyclical, not structurally declining. The flag is
false for the right arithmetic reason and the wrong comfort — the volatility that keeps it from a
three-year losing streak is itself the durability problem.
Structural decline — checked and absent (X3)
A real search for structural decline finds none. Revenue is cyclical, not secular: the 2023-2024 trough reversed in 2025. Production is rising, not shrinking — 2,622 Bcfe in 2025 versus 1,375 Bcfe in 2024 (chiefly the merger) and 1,335 Bcfe in 2023 [30]. Reserves grew to 25,880 Bcfe, and the company holds delivery commitments of roughly 7,800 Bcf over the next 20 years [31] [32]. The concern here is not a shrinking business; it is an unpredictable one.
The year-10 case, both ways
The strongest case that revenue and adjusted FCF are higher in a decade. U.S. gas demand is on a structural rise — LNG export capacity is expanding, coal plants are retiring, and data-center and industrial load is growing; management sees the market tightening through 2027 [33]. Expand is the largest, lowest-cost, best-located producer to serve it, with Haynesville acreage adjacent to Gulf Coast LNG and Appalachian gas near demand centers, 25,880 Bcfe of reserves, an investment-grade balance sheet, and a hedge book that floors over 60% of projected 2026 gas volumes [34] [35]. Consensus sees free cash flow of roughly $2.6B to $2.9B a year across FY2026-FY2029 — all above the current figure. On volume and demand, revenue a decade out is plausibly higher.
Consensus figures: derived from the estimates feed via fit_features.consensus_forward_yield; not tied to a filed page.
The strongest doubt. "Higher, with very high conviction" is the standard, and a commodity price-taker cannot meet it on cash flow. Year-10 adjusted FCF is a levered function of the 2035 Henry Hub price, which no one — not management, not the sell side — can forecast; the six-year record from $8M to $2.3B is the proof, and the predecessor's bankruptcy is what happens when the price stays low [36] [37]. A ten-year proved reserve life means production past a decade depends on drilling economics that hold only if prices cooperate. And share count has roughly doubled since 2021 through stock-funded mergers, diluting per-share cash even when aggregate cash rises.
The read. The gate does not hold. Year-10 revenue is probably higher, on volume and demand growth. Year-10 adjusted free cash flow higher with very high conviction is a claim a commodity price-taker structurally cannot support — and this one has already demonstrated, in bankruptcy, what the down-leg of the price cycle does to it. The genuine doubt is specific: cash flow rests on an unforecastable Henry Hub price, and the enterprise has no pricing power and no proven cycle-survival record to fall back on. What would change the read is not achievable from filings — a durable, contracted price floor across the full production base (rather than a two-year hedge book) is the kind of evidence that would remove the doubt, and it does not exist.
FCF consistency (P2)
The deterministic feature fit_features.fcf_stability is not_computable: its rolling series is
empty because the profile computes stability on adjusted FCF, and the XBRL feed carried no
stock-based-compensation line, so the adjusted series never formed. Computed by hand on reported FCF,
the picture is unambiguous.
Source: derived from reported free cash flow, FY2020-FY2025; only two full five-year windows exist post fresh-start [38] [39].
The rolling five-year average moved from about $805M (FY2020-24) to about $1,168M (FY2021-25) — a 45% shift between the only two windows the short post-emergence history allows. Individual years span $8M to $2,302M. This is not the healthy underwriting cadence the framework tolerates in insurers and banks, where a negative year every five to eight years is a mechanism of the business model. There is no cadence here — the swings track the gas price, an external variable with no cycle length. And the adjustment makes it worse, not better: stock-based compensation is small ($33M-$46M in recent years), but real acquisition spend was material ($1,967M in 2022, $459M in 2024) [40] [41], so a properly adjusted FCF in the weakest year would be negative. Genuinely unpredictable, not merely volatile. The precise adjusted-FCF figure and its yield are worked in the Yield tab; the balance-sheet resilience that lets it outlast a down-leg is in Self-Help.
Self-Help
Expand Energy can outlast a gas downturn with ease — investment grade, roughly 0.8x net-debt-to-EBITDA, no note maturities until 2029, and a fully undrawn $3.5 billion revolver. But the buyback flywheel the framework hunts for is absent: the share count has risen sharply, driven by the all-stock Southwestern merger, and management's own stated priority is debt paydown ahead of repurchases. The delivery record and insider buying are clean.
The balance sheet against the problem's duration
The problem here is cyclical, not existential: a soft natural-gas strip against a producer whose Haynesville breakevens management says fell 15% in 2025 [1]. The balance sheet is built to sit through it.
Net Debt ($M)
Net Debt / EBITDA (x)
Undrawn Revolver ($M)
EBITDA / Interest (x)
Source: net debt = $5,009M long-term debt less $616M cash, FY2025 balance sheet [2]; leverage and interest coverage derived from FY2025 income from operations $2,471M plus $2,980M of depreciation, depletion and amortization against $235M interest expense [3]; revolver availability [4].
Net debt of $4,393 million against an EBITDA proxy of roughly $5,451 million (income from operations of $2,471 million plus $2,980 million of depreciation, depletion and amortization) puts leverage near 0.81x, and interest expense of $235 million is covered about 23 times [5]. The company reached investment-grade ratings on the Southwestern merger close in October 2024, which released the subsidiary guarantees and stripped the restrictive covenants from its legacy notes [6]. The deterministic feature file could not classify the balance sheet because it lacked an EBITDA input; on the filed figures the class is clearly moderate-to-strong, not levered — which matters because it means the framework's ordinary ~10% adjusted-yield reference line applies, not the ~25% bar reserved for levered names.
The maturity wall is the decisive fact for the outlast question, and there is no wall.
Source: FY2025 Annual Report, Note 4 debt-maturity table ($5,025M total, excluding issuance costs) [7].
Nothing comes due before 2029, when $1,925 million of senior notes (the 5.375%, 5.875% and 6.75% tranches) mature, followed by $1,200 million in 2030 and $1,900 million of 2032 and 2035 notes thereafter [8]. The $3.5 billion revolving credit facility was undrawn at year-end, was upsized from $2.5 billion and extended to September 2030 with two one-year options in the September 2025 refinancing, and left approximately $3.5 billion available [9]. Against FY2025 operating cash flow of $4,575 million and a 2026 capital budget of $2.75–$2.95 billion [10], the company can fund its program from cash flow and sit on the balance sheet through a multi-year price trough without a forced action. Nothing in the maturity profile forces the company's hand before the end of the decade.
Where the cash actually goes
The other half of the same pillar is whether capital allocation is able and willing to point at repurchases exactly when a dislocation makes them most valuable. Here the record and management's words agree, and they point the other way.
The 2025 waterfall, stated in the 10-K, runs: base dividend of $2.30 per share, then $1.0 billion of net debt reduction, and only then "75% of the remaining free cash flow" split between buybacks and additional dividends [11]. The filing then states the priority for the year ahead plainly: "In 2026, the Company will continue to prioritize debt reduction while continuing to effectively return cash to shareholders" [12]. Interim CEO Mike Wichterich put the ordering in the same terms on the Q4 call: "Having a fantastic balance sheet comes first. That is why you are seeing our priority to pay down debt. I think we will lean into that" [13].
This is the pattern the framework flags: debt paydown taking precedence over repurchases at the moment repurchases would compound fastest. The mitigant is that the debt-first phase is largely finished. On the Q1 2026 call, management reported reducing gross debt by $1.3 billion in April — meeting the full-year $1 billion target in a single quarter — and returning over $290 million through dividends and buybacks [14], then said that having hit the goal, "In the rest of the year, we can rebalance that with share buybacks and shareholder distributions" [15]. The willingness is loosening as the balance-sheet target is reached; it was not the priority during the drawdown.
The repurchase record — executed, not authorized
Cash has gone to repurchases in only two meaningful years, and the amounts are small against the cash returned as dividends.
Source: FY2025 Annual Report, Consolidated Statements of Cash Flows and Note 10 Equity [16]; dividends per the cash-flow statement, as reported.
The $2.0 billion authorization that ran from 2021 to 2023 retired only about 4.4 million shares for $357 million before it expired at the end of 2023 [17]. The Board authorized a fresh $1.0 billion program in October 2024; against it the company bought nothing in 2024 and 0.9 million shares for $100 million in 2025 [18]. Cumulatively, repurchases have retired on the order of 5 million shares since emergence. Set that against the issuance below.
Source: share counts from fit_features.share_count_trend, reconciled to the FY2025 10-K weighted-average diluted share disclosure [19].
The count has not fallen — it has jumped. The step from 143 million in 2023 to 240 million in 2025 is the Southwestern merger: on October 1, 2024 the company issued approximately 95.7 million shares, worth roughly $7.9 billion, to Southwestern's holders [20]. Warrant exercises added a further 7.5 million shares in 2025 alone [21]. The feature file records the share count as rising, with a 5-year growth rate near 90% — a figure inflated by the 2018 reverse split and 2021 fresh-start recapitalization, but the direction is not in doubt.
The framework treats a share count rising on stock-financed acquisitions as a disqualifier for the repurchase-flywheel pillar. Expand's count roughly doubled on the all-stock Southwestern merger — a single deal issued 95.7 million shares against the roughly 5 million cumulatively retired by buyback. The flywheel that turns a 10% yield into ~10% of EPS growth is not present here; the share count is working against the shareholder, not for them.
Management's buyback intent, from the record
The transcript question-and-answer is consistent with the record: repurchases are framed as opportunistic and deliberately unscheduled, subordinate to the balance sheet. Wichterich on the Q4 call: "We would like to be less prescriptive on our buybacks. It is a terrible policy to tell the market exactly when we are buying back shares and when not" [22]. On Q1 2026: "think of our buyback program as opportunistic, right, relative to the value we can get in buying back" [23], framed within a commitment to "be investment grade, not just in the good times, but through the cycle" [24]. This is a company that will repurchase when the balance sheet allows and the price is right, not one running a mechanical countercyclical buyback into fear.
Insiders have, however, been buying alongside — a genuine, if small, signal covered under credibility below.
The levered exception does not apply
The framework tolerates a rising count and debt-first allocation only for a levered name throwing off a ~25%+ adjusted yield with a demonstrated multi-year share-count reduction. Expand meets none of the three legs: leverage is ~0.8x and investment grade, not levered; the consensus forward free-cash-flow yield computes to roughly 9–13% of the current market cap (consensus estimates), not 25%+; and the share count has risen, not halved. The levered exception is off the table.
The absurdity check
The feature file leaves float_retirement_years not computable, because adjusted free cash flow (FCF less stock-based compensation less average acquisition spend) could not be derived from the available data. On reported figures the arithmetic is straightforward: at $91.52 the market capitalization is roughly $22.0 billion; FY2025 reported free cash flow was $1,839 million, so retiring the entire float would take about 12 years of it. On consensus forward free cash flow — near $2.9 billion for FY2026 — the figure compresses to roughly 7.6 years. Either way the price sits far from the ~3-year mark that would signal an absurd, self-liquidating valuation. The price is cheap on cash flow; it is not making a claim that cannot survive.
Dividend safety
The dividend is not a material part of the return case: the $2.30 annualized base dividend is a 2.5% yield at $91.52, below the level at which the case would lean on it. It is, however, well covered. The base payout of roughly $553 million (240 million shares at $2.30) is covered about 3.3 times by FY2025 free cash flow of $1,839 million, and the base has been paid every quarter since it was initiated in 2021, with variable dividends layered on top only when free cash flow allowed — $765 million total in 2025, including one variable payment [25]. The Board declared the $0.575 quarterly base again in February 2026 [26]. A cut would require gas prices low enough to push cash flow below the modest base for a sustained period; the variable component absorbs volatility first.
Management credibility
The promise-versus-delivery record over the last two years is clean — under-promise, over-deliver, the opposite of the promotional pattern the framework excludes for.
Source: forward commitments and outcomes from the earnings-call archive, Q4 FY2024 through Q1 FY2026 [27], [28].
The two testable promises — synergies and debt reduction — were both raised and beaten [29], [30]. Insider behavior aligns: sixteen open-market purchases over the window against fifteen sales (the sales dominated by legacy Blackstone/Vine holders unwinding rather than operating management), including buys through the 2026 drawdown by the interim CEO (1,000 shares at $88.90 in June 2026), the new CFO Marcel Teunissen (2,000 shares at $92.88), and former CEO Domenic Dell'Osso before his departure. Economic ownership is modest in absolute terms — this is a professionally managed, post-bankruptcy company with no founder stake, majority-held by Fidelity, BlackRock and Vanguard — but the direction is buying, not distributing.
The counter-fact is stability, not promotion. Dell'Osso ran every call through Q3 2025 and was replaced by Chairman Wichterich on an interim basis by the February 2026 call ("the change that we made last week"), with the CFO seat also turning over (Mohit Singh, then interim, then Teunissen) and the headquarters moving to Houston, alongside a strategy pivot toward marketing "beyond the wellbore" [31]. No call states why the CEO left, and a permanent CEO search was still open through mid-2026. That is real execution uncertainty to weigh in Durability and against the Yield normalization — but it is a leadership-transition risk, not the promotional-CEO exclusion, and it does not offset a delivery record that has been better than management's own guidance.
Clock
What closes the gap for Expand Energy is a natural-gas and LNG pricing cycle plus the company's own margin self-help — a roughly $0.20/Mcf uplift management sizes at about $500 million of repeatable free cash flow [1]. The setup is thin for a fear-driven entry: the drawdown is only 29% on muted volume, the sell side is already bullish (mean target $124, 20 buy / 6 hold / 0 sell), and consensus already expects a FY2026 cash-flow step-up. Listed options run to January 2028; 30-day implied volatility sits near 35%.
What has to happen — the mechanism
Expand is a commodity producer, not a franchise waiting to be re-recognized. The gap closes two ways, and both are visible in the record rather than a matter of sentiment.
An industry gas-and-LNG repricing cycle — the fundamental driver. As the largest U.S. natural-gas producer, Expand's cash flow tracks the Henry Hub and Gulf Coast gas curve, which reprices as new LNG export trains ramp on the Gulf Coast. The company has committed delivery of roughly 7,800 Bcf of gas over the next 20 years, tying its volumes to that demand build [2]. This is the Dislocation's mirror image: gas is out of favor now, and the re-rating requires the commodity to firm, not the market to re-read the business. Because it is an industry-wide cycle, the mean reversion is structural — but it is also outside the company's control, and no single date sets it.
Company-specific margin self-help — the piece with a nearer clock. Management has pivoted from a pure drill-and-produce model to a "wellhead-to-water" marketing effort it sizes at about $0.20/Mcf, or roughly $500 million of repeatable incremental free cash flow per year [3]. It is already in motion: a 1.15-million-tonne-per-year offtake SPA signed with Delfin LNG, 0.5 Bcf/d of term sales and firm transportation added over six months, and about $90 million of volatility monetization booked in Q1 FY2026 [4]. Management frames the timing as "stacking singles and doubles": the premium-market and volatility buckets are underway now, while the new-demand bucket (Delfin) is a four-to-five-year build [5].
Dated catalysts
The nearest hard catalyst is Q2 FY2026 earnings on July 28, 2026 — the first printed quarter under the new CFO and the first read on the marketing pivot's cash contribution. The permanent-CEO decision falls in a management-stated window of six-to-nine months from February 2026, i.e. roughly August through November 2026, resolving the leadership reset that accompanied the founder-era exit.
Sources: Q1 FY2026 earnings call, April 29, 2026 [6]; FY2025 Annual Report (Form 10-K), delivery commitments [7]; earnings date from the consensus calendar.
Base rates — this name's own history
The base-rate exercise is limited here, and the limitation is the finding. Expand's tradable history begins February 11, 2021, when the predecessor (Chesapeake) emerged from Chapter 11; the current entity dates only to the Southwestern merger of October 1, 2024. So the price record is roughly five-and-a-half years, spanning a bankruptcy exit, a 2022 gas spike, a 2023–24 price collapse, and a corporate reconstitution — a short and structurally shifting sample, not a decades-long franchise curve.
Source: company daily price history, month-end closes, Feb 2021 – Jul 2026 (as reported).
Every drawdown of comparable depth in this record has been a gas-price move, and each has round-tripped — but on very different clocks. The 2022 pullbacks recovered in two to three months; the 2022–24 episode, which coincided with a sustained gas-price collapse, took 26 months to reclaim its peak.
Source: drawdown episodes computed from company daily price history, peaks and troughs on closing prices (derived, as reported).
Source: derived from company daily price history (closing prices).
Two facts govern the read. First, the deepest drawdown this name has ever printed is 33% — there is no precedent here for the 60–70% forced-selling capitulation that Ruchir's framework treats as the moment risk disappears. Second, the current episode (29% peak-to-trough, 229 days and counting) already resembles the slow-grind 2022–24 episode more than the sharp two-to-three-month V's, because it is tracking a soft gas tape rather than a single event. The muted 1.4× volume gauge documented in the Dislocation tab reinforces that this is a grind, not a panic.
The 18-month test
Re-recognition within 18–24 months is plausible but not clean. The self-help mechanism has a nearer clock — the premium-market and volatility buckets are already contributing and can show in printed cash flow across FY2026–27 — and consensus already models a FY2026 free-cash-flow step-up (below). Against that, the fundamental driver is a commodity cycle no management controls, and this name's own history includes a 26-month round trip when gas stayed weak. The honest read: the margin self-help can re-rate cash flow inside the window, but a full re-rating of the equity still depends on the gas curve firming, and the 2022–24 precedent shows that leg can take years rather than quarters. This read is falsified if the roughly $0.20/Mcf margin uplift fails to appear in reported free cash flow across FY2026–27 — the falsifier that ties this tab to the Self-Help and Yield arithmetic.
What consensus expects, and when
The sell side is not capitulated — the opposite. Twenty of 26 analysts rate Expand a buy, none a sell, and the mean 12-month target of $124 sits about 36% above the $91.52 close. That positioning cuts against the fear-driven entry the framework hunts: there is no washed-out consensus to fade here.
Buy ratings (of 26)
Mean target ($)
Implied vs $91.52
Source: consensus analyst estimates and price targets, as of July 2026 (26 analysts; ratings 3 strong-buy / 17 buy / 6 hold / 0 sell).
On timing, consensus expects the recovery to show in printed numbers in FY2026. Modeled free cash flow steps from about $1.99 billion in FY2025 (a 9.0% yield on today's market cap) to roughly $2.88 billion in FY2026 (13.1%), holding near $2.6 billion in FY2027 — comfortably above Ruchir's 10% default bar, the point developed in Yield. The candidate quarter to begin confirming that path is Q2 FY2026, reported July 28, 2026.
Source: consensus analyst free-cash-flow estimates; yields computed on the $22.0B market cap (derived from fit_features.consensus_forward_yield).
One counter-fact sits inside this: near-term estimates have been trimmed, not raised. The current-quarter EPS estimate has slipped from about $1.32 ninety days ago to $1.10, and downgrades have outnumbered upgrades over the last 30 days — the printed path bends up over the full year even as the near-term revisions bend down.
Instrument facts
Stated as facts, not advice.
Listed options on Expand extend well beyond the framework's 12-month floor: LEAPS trade with January 15, 2027 and January 21, 2028 expiries, the latter roughly 18 months out. As of July 24, 2026, the 30-day mean implied volatility was about 35% (AlphaQuery), below the ~50–55 reference line the framework treats as acceptable and well under the 60–70 elevated zone. Options desks note an elevated near-term put skew — traders paying up for downside protection — even as the headline volatility level is moderate.
Long-dated listed options exist to January 2028, and current implied volatility (~35% as of July 24, 2026) is within the framework's acceptable range — so the framework's watchlist-only carve-out for names lacking long-dated instruments does not apply here.
Source: option expiries and implied-volatility level from public options data as of July 24, 2026 (AlphaQuery, Barchart); stated as dated facts.